
The Most Important Passers On Every Premier League Team

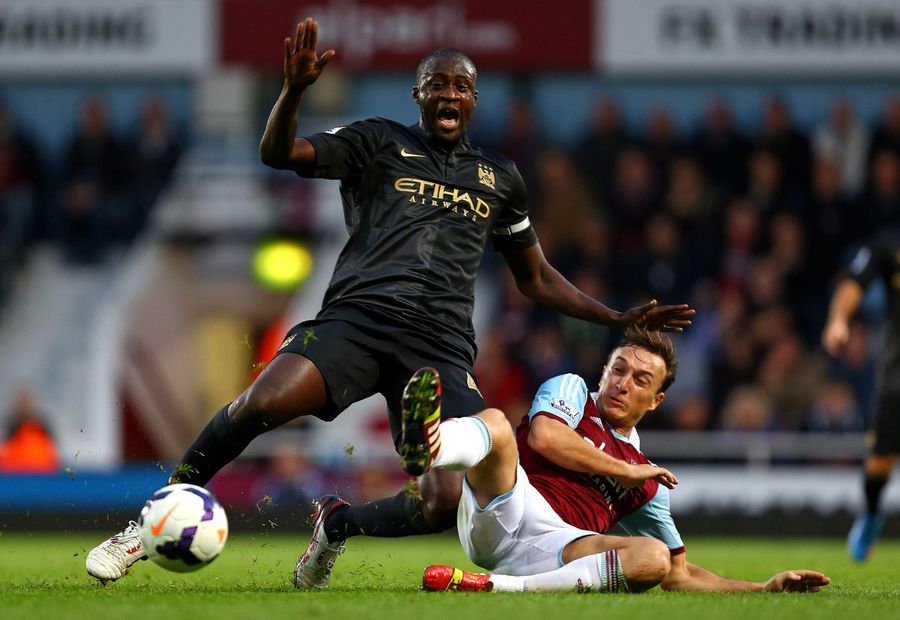
Coming into this weekend, Yaya Toure, Manchester City's all-everything central midfielder, leads the EPL in passes per 90 min with 92.8. That is a lot. It would be logical and intuitive to conclude that Toure is the most influential passer in the EPL. But that distinction actually belongs to West Ham's Mark Noble, despite the fact he is way down at 26th in the EPL with 63.8 passes per 90 min.
As is the case with most stats—and this is particularly true of stats in soccer—context is key. Manchester City passes 606 times per game while West Ham only passes 385 times per game. By taking each player's passes per 90 and dividing it by their team's passes per 90 we can create a pass usage rate for each player which represents the share of their team's passes a player contributes.
| Name Passes/90 | Team Passes/90 | Pass Usage Rate | |
| Yaya Toure | 92.8 | 606 | 15.3% |
| Mark Noble | 63.8 | 385 | 16.6% |
Does this mean that Mark Noble is more productive than Toure, or that he could succeed in the same role on City, upping his workload by 50 percent? Probably not. But Noble fills the role capably for West Ham, and has been more central in his side's play than Toure at City, which is impressive.
It's also important to note that usage rates are not meant to be predictive of future performance or indicate relative ability among players. But they are useful data points that help provide context to a player's performance within his team. To make an analogy to the NBA, a league with which "usage rate" is more commonly associated: Player A scores 20 per game on a team that averages 110 on 107 possessions while Player B scores 18 per game on a team that averages 80 points and 80 possessions. Who is more important?
Here are the most influential passers for each EPL team so far this year (minimum 270 minutes played).

You might notice that the majority of these players are central or defensive midfielders. That makes sense, as the major role of players in these positions is to be the nexus of a team's ball distribution. Dejan Lovren, Liverpool's center back, is an outlier on this list and indicates that—while Liverpool have been good in possession—they are doing a poor job of advancing their ball distribution up the field.
That's not to say that usage rate is only useful at the top end. You can compare players at similar positions—say, the wings at Chelsea, United, and Spurs—and see who's more involved. And if something seems off, like Lovren at Liverpool, it's as good a place as any to start looking for reasons why a team is struggling or succeeding.
Another usage rate in soccer is the attacking usage rate. This is calculated by taking a player's number of shots created (shots taken + shots assisted) and dividing it by their team's total. This is a truer comparison to the NBA's usage rate, and a little in the spirit of stats that rely on it, because taking a shot or assisting on one is an act of creation in soccer, rather than a matter of course, as it is in basketball.
Here are the top five in the EPL:
| Name | Team | Shots Contributed / 90 | Team Shots / 90 | Shot Contribution Rate |
| Wilfried Bony | Swansea City | 5.3 | 9.0 | 59.2% |
| Ángel Di María | Manchester United | 5.4 | 12.2 | 44.3% |
| Mario Balotelli | Liverpool | 6.7 | 15.5 | 43.1% |
| Christian Eriksen | Tottenham Hotspur | 4.5 | 10.7 | 42.5% |
| Kevin Mirallas | Everton | 5.4 | 12.8 | 42.4% |
You can further break this statistic down into its two components: shot usage and creation (shot assist) usage. Some attackers are shooters while some play the role of provider. Here are the top shooters and providers for each EPL team.
| Team | Player | Shot Usage | Player | Shot Assist Usage |
| Arsenal | Aaron Ramsey | 18.4% | Alexis Sánchez | 27.9% |
| Aston Villa | Andreas Weimann | 15.7% | Ashley Westwood | 34.8% |
| Burnley | Lukas Jutkiewicz | 28.0% | Lukas Jutkiewicz | 17.6% |
| Chelsea | Diego Costa | 22.1% | Cesc Fàbregas | 23.6% |
| Crystal Palace | Jason Puncheon | 19.7% | Jason Puncheon | 25.3% |
| Everton | Kevin Mirallas | 27.5% | Leighton Baines | 21.4% |
| Hull City | Nikica Jelavic | 20.7% | Stephen Quinn | 24.2% |
| Leicester City | Leonardo Ulloa | 22.7% | Riyad Mahrez | 16.8% |
| Liverpool | Mario Balotelli | 37.5% | Raheem Sterling | 23.6% |
| Manchester City | Sergio Agüero | 33.1% | Samir Nasri | 23.8% |
| Manchester United | Wayne Rooney | 27.6% | Ángel Di María | 32.3% |
| Newcastle United | Emmanuel Riviere | 15.7% | Rémy Cabella | 27.2% |
| Queens Park Rangers | Niko Kranjcar | 27.9% | Joey Barton | 33.5% |
| Southampton | Graziano Pellè | 27.8% | James Ward-Prowse | 23.7% |
| Stoke City | Peter Crouch | 16.9% | Victor Moses | 24.1% |
| Sunderland | Connor Wickham | 24.8% | Sebastian Larsson | 25.9% |
| Swansea City | Wilfried Bony | 45.3% | Gylfi Sigurdsson | 33.8% |
| Tottenham Hotspur | Nacer Chadli | 25.1% | Christian Eriksen | 23.5% |
| West Bromwich Albion | Saido Berahino | 22.1% | James Morrison | 31.8% |
| West Ham United | Diafra Sakho | 27.3% | Stewart Downing | 31.3% |
Chart by Sam Woolley; Image via Getty
Alex Olshansky is a freelance writer who contributes to Stats Bomb, Bloomberg Sports' Stats Insights, and Sounder at Heart. You can follow him on Twitter here, and follow his work on his blog, Tempo Free Soccer.