Interactive Maps and Data Tools
Labor Market Information Resources and Data: Home | By Customer | By Subject | By Geography | Data Search Tools | Online Services
The Interactive Labor Market Data Tools page features interactive California labor force and unemployment maps, dynamic charts and data tables. These interactive tools and associated data are updated monthly. Please visit the EDD Data Release Schedule to see the next planned update.
Labor Force and Unemployment Interactive Map
The interactive maps below displays both seasonally and non-seasonally adjusted California Labor Force and Unemployment data for California and its areas. These maps and associated data are updated monthly at the time of the official EDD Press Release.
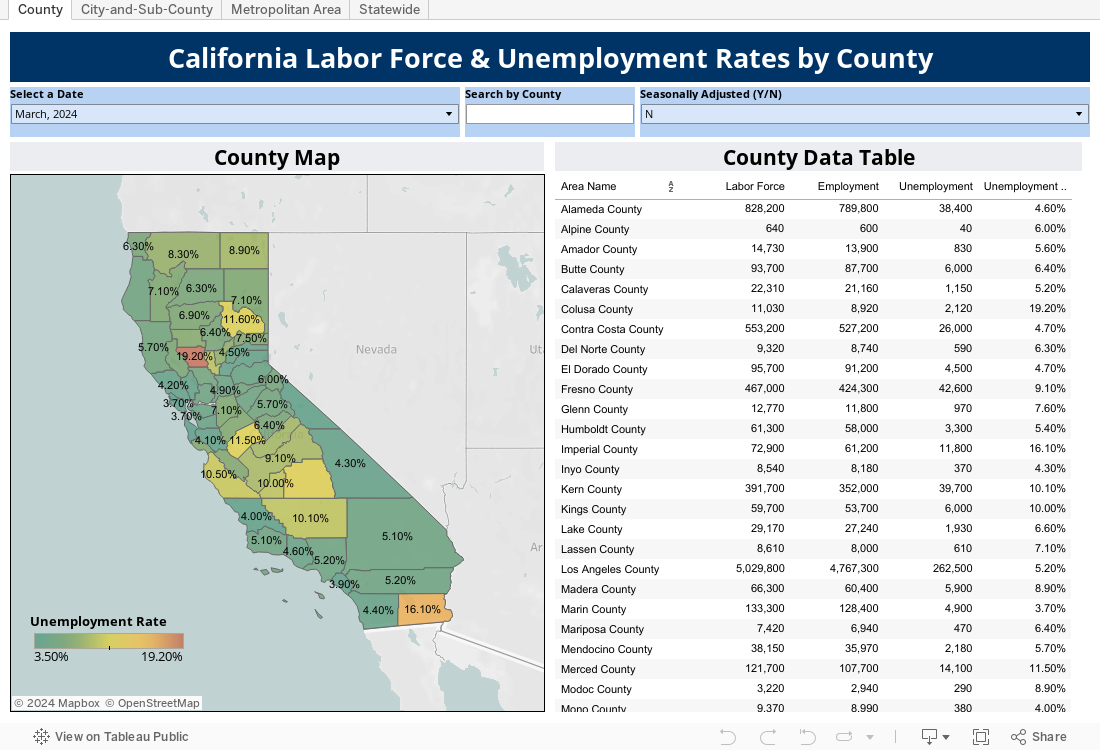
California Labor Force - Seasonally Adjusted
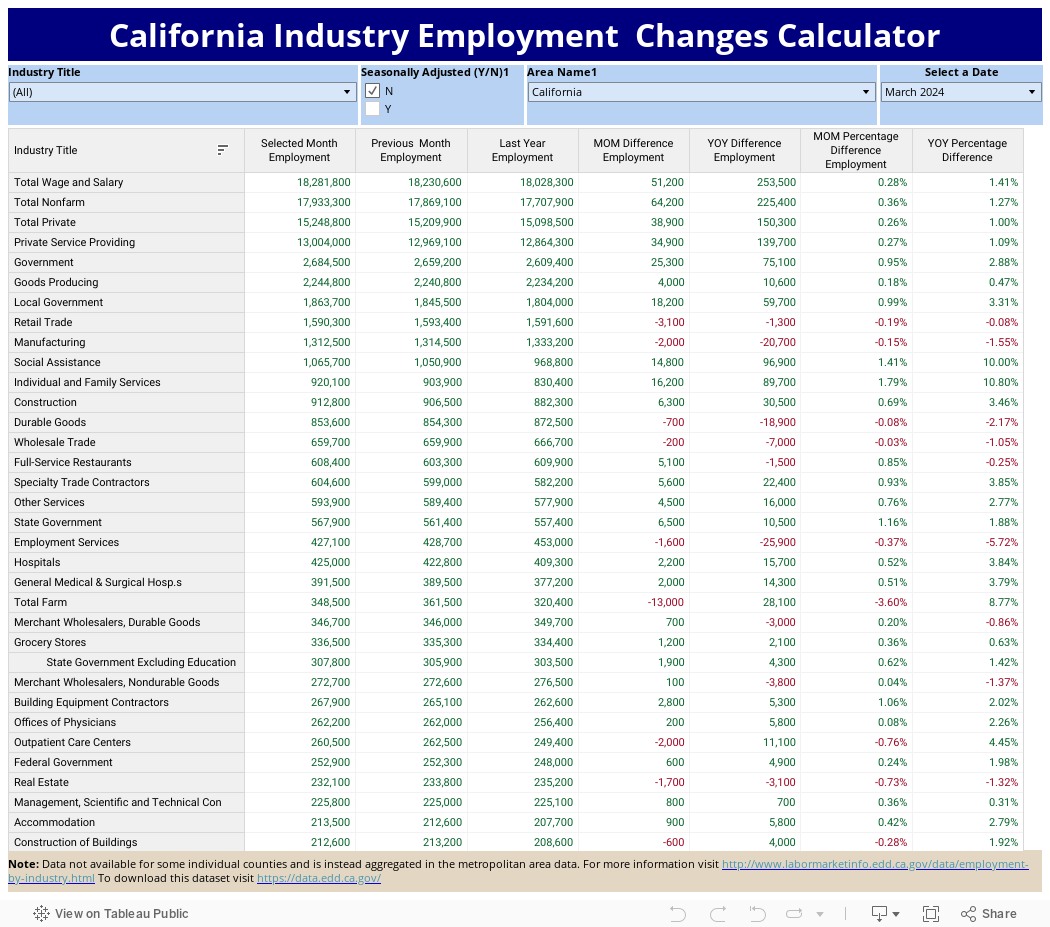
California Industry Employment Changes Calculator
The California Industry Employment Changes Calculator can be used to compare month-over-month, or year-over-year changes in Industry Employment for California and its areas.
How to use this tool.
Select the Area Name, Date, and seasonality type (Seasonally Adjusted Y/N) to begin the comparison. The tool will then output current month, previous month, and last year employment data for each industry listed. Additionally, the tool will calculate numerical and percentage change differences for each industry listed. To download the raw data files for this tool visit the EDD Open Data Portal.
Additional Interactive Labor Market Data Tools
- California Industry Employment Changes Calculator
- California Occupational Guides
- California Veterans Labor Statistics
- Earn and Learn Occupations Tool
- Employment Projections
- Find Local Employers
- Labor Market and Economic Indicators
- Online Job Vacancy Statistics
- Regional Planning Units
- Supply and Demand Tool
- The Economy – Labor Force and Industry
- Top Labor Market Statistics