Real Estate
Building Permits and the State of the Economy
Building permit data is an indicator of the state of the economy.

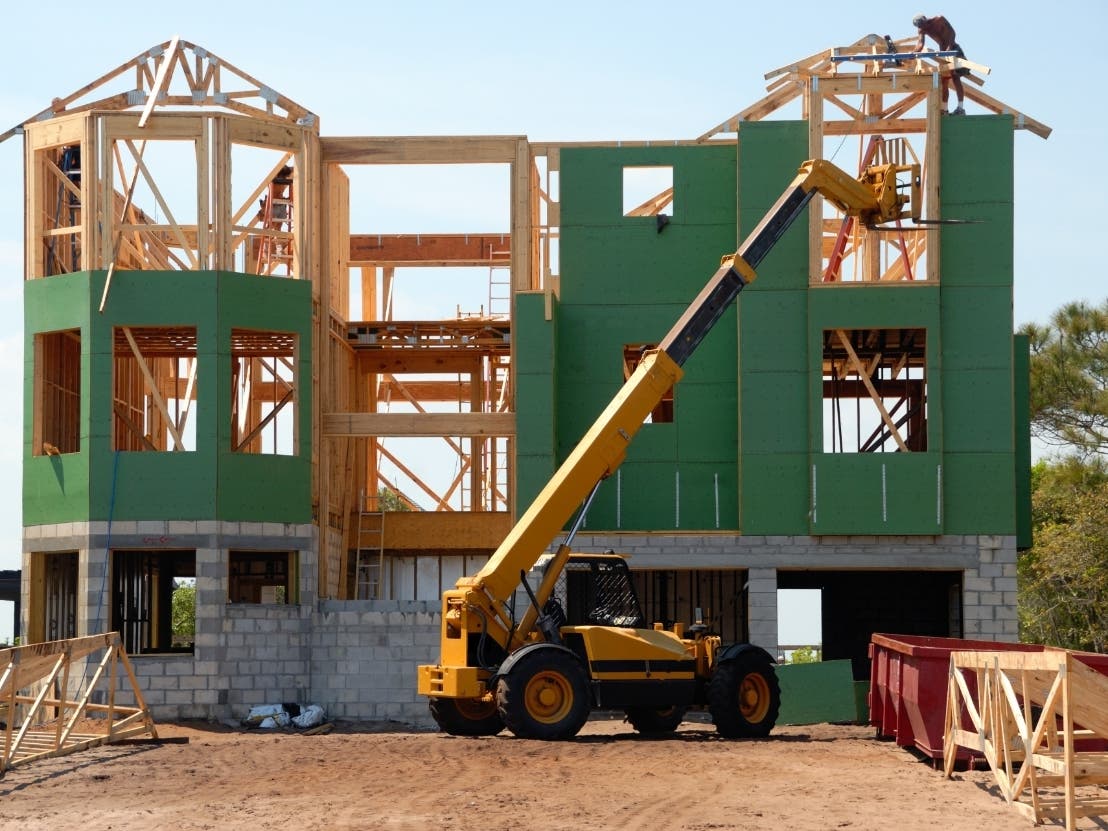
The U.S. Census Bureau’s Building Permits Survey is closely watched by economists and investors alike. According to Investopedia, “building permits are a type of authorization that must be granted by a government or other regulatory body before the construction of a new or existing building can legally occur.” Investopedia further explains how building permit data is an indicator of other economic activities associated with building construction, such as financing and employment. Therefore, the data can signal economic stagnation or growth and can be an indicator of the state of the economy. For instance, a rise in building permits for single family homes can reveal that more citizens have improved their financial situation and are able to afford their residences.
A study by Apartmentguide.com states that the number of building permits issued hit a high in 2005 with 2.2 million building permits. After dropping to a 26-year low in 2009 with fewer than 600,000 building permits, the market trended toward recovery with 1.3 million building permits issued in 2018.
At Data Z, we compile city-level and state-level building permit data on the total number of building permits, building permits for single-family homes, and building permit data for single-family homes indexed to 2005.
Find out what's happening in Houstonwith free, real-time updates from Patch.
.png)
Looking at our building permits data from 2019, the five states with the highest number of total building permits were Texas (209,822), Florida (154,297), California (110,197), North Carolina (71,296), and Georgia (53,812). These states also had the highest number of single-family building permits in 2019. Furthermore, Data-Z data from 2000 to 2019 shows that these five states have consistently issued the highest number of total building permits.
There may be several reasons as to why these states are at the top, including their size. To account for their differing populations, let’s look at how many building permits are issued for every 1,000 residents. According to our calculations per 1,000 residents, the highest building permit rates were Idaho (9.92), Utah (8.95), Texas (7.24), Florida, (7.18) and South Carolina (7.00). Although California is ranked as the most populous state and comprises 12 percent of the nation’s population, its building permits per 1,000 residents ranking was only 36 out of 50 (where one is the highest rate and 50 is the lowest).
Find out what's happening in Houstonwith free, real-time updates from Patch.
Another explanatory factor for high building permits per state could be differing housing prices. For example, cities and metropolitan areas in Texas tout some of the cheapest housing prices in the nation. Apartmentguide.com claims that for the price of one home in California, you can buy six in Texas. Data-Z offers data on the Cost of Living Index from Numbeo, which reveals that cities in Texas have low costs of living. Out of the 45 cities that were ranked according to their Cost of Living Index, Dallas, Fort Worth, Houston, and San Antonio were among the most affordable cities, and were less than the U.S. average.
.png)
The chart below shows how the median home values of Dallas, El Paso, Houston, and San Antonio compared to the U.S. average median home value of $326,097. Dallas, which at $220,524 has the highest median home value of the cities below, has a median home value approximately 33 percent lower than the U.S. average. These low home values and costs of living may be one factor promoting increased migration into Texas and, therefore, higher total and single-family building permits.
.png)
Lastly, we took a look at the migration net rate per 1,000 for California, Florida, Georgia, North Carolina, and Texas. This metric shows how many residents each state gained or lost per 1,000 residents. With the exception of California’s negative rate, each of these states had migration rates that were significantly higher than the U.S. average in 2019. High migration could be one factor contributing to higher numbers of building permits being issued.
.png)
As the U.S. continues to adapt and combat the current pandemic, it will be interesting to see how the number of building permits in these top states changes in 2020. You can explore more state and city data at data-z.org
Meher Kaur is a rising senior double majoring in Economics and International Studies at the University of Richmond. She is currently a Data Research Intern at Truth in Accounting, a nonprofit government finance watchdog organization in Chicago.