A Faster Convergence of Shelter Prices and Market Rent: Implications for Inflation 


Federal Reserve Bank of Boston
The Federal Reserve currently faces a “last-mile” problem in bringing inflation back to its 2 percent target. Following the series of federal funds rate hikes that began in March 2022 and ended in July 2023, core (excluding food and energy) Personal Consumption Expenditure (PCE) inflation dropped from a year-over-year peak of 5.6 percent in February 2022 to 2.9 percent in December 2023. At the end of 2023, hopes were high that falling inflation would allow the Fed to cut interest rates several times in 2024. However, the disinflation process slowed noticeably in early 2024, prompting questions about how soon the Fed can attain its 2 percent inflation target. The price of shelter accounts for a substantial share of the indexes used to measure overall inflation—the PCE and the Consumer Price Index (CPI)—and it has remained significantly above its pre-pandemic trend in recent months.1 Therefore, it is important to understand how shelter prices will likely evolve during the current disinflation process.
I estimate that from June 2024 to June 2025, based on the current difference between market rent and CPI shelter (shelter prices as measured in the CPI) and the pace at which the two converge in the post-pandemic period, CPI shelter will grow 1.6 percentage points more than it would if there were no such gap. This gap and the resulting growth in CPI shelter will lead to an additional growth in core (excluding food and energy) CPI and core PCE of 0.74 percentage point and 0.29 percentage point, respectively, over the next 12 months, according to my estimates, thus adding to the Fed’s challenge of returning inflation to 2 percent.
Sign up for Research Department Updates.
The Source and Pass-through of Market–Shelter Gaps
CPI shelter might be expected to move closely in line with market rent. However, several studies demonstrate that CPI shelter tends to lag market rent.2 An important reason for this lag is that market rent reflects only the rents paid by new tenants, whereas CPI shelter captures rents paid by new and existing tenants. I refer to the difference between market rent and CPI shelter at any point in time as the “market–shelter gap.”
There are also reasons to suspect that the pace at which CPI shelter catches up to market rent—the so-called pass-through of the market–shelter gap into CPI shelter—might be faster now compared with the period before the onset of the COVID-19 pandemic. For example, due to lifestyle changes related to the pandemic, including the increase in remote work, renters may be more inclined to relocate or change dwelling type, which would result in more tenants paying market rent and thus market rent being reflected in CPI shelter more quickly. Moreover, the pass-through of a large increase in market rent into CPI shelter may be different from the pass-through of the large decrease in market rent observed during the Great Recession, which would affect comparisons between current and historical trends.
I find that the pass-through of the market–shelter gap into CPI shelter does indeed appear to be faster now than before the pandemic. According to my estimates, a 1 percentage point larger market-shelter gap leads to 0.4 percentage point growth in CPI shelter over the subsequent year in the post-pandemic period (since the beginning of 2021) compared with 0.19 percentage point growth historically. This finding implies that CPI shelter will continue to grow relatively rapidly as a result of the current market–shelter gap. But while CPI shelter may grow an additional 1.6 percentage points over the next 12 months relative to there being no gap, the gap will close relatively quickly, according to my estimates, suggesting that CPI shelter growth will slow significantly in future years.
The Outsized Effect of Shelter Prices on Inflation
As noted, shelter prices have important implications for overall inflation and, in turn, monetary policy because they account for such a large share of the indexes that measure inflation. As of April 2024, shelter made up 36.1 percent of the CPI, the most commonly followed US inflation measure. If shelter prices were excluded, monthly annualized core CPI inflation rates would have ranged from 1.8 to 2.4 percent from July 2023 through February 2024, whereas the full, realized core CPI inflation rates over this period ranged from 3.8 to 4.7 percent.
Due to differences in methodology, shelter accounted for a smaller but still sizeable 15.5 percent of the PCE, which is the Federal Reserve’s preferred price index for measuring inflation. All else being equal, rapid growth in shelter prices—because they play such a prominent role in boosting overall inflation—are therefore likely to lead to more restrictive monetary policy. This inference may help to explain why the Fed has maintained a restrictive stance over the past year. It raised the federal funds rate to 5.25 to 5.50 percent on July 26, 2023, and had held it at that level as of mid-June 2024. Looking ahead, continued rapid growth of shelter prices could make it difficult for the Fed to achieve its target inflation this year.
The Relationship between CPI Shelter and Market Rent
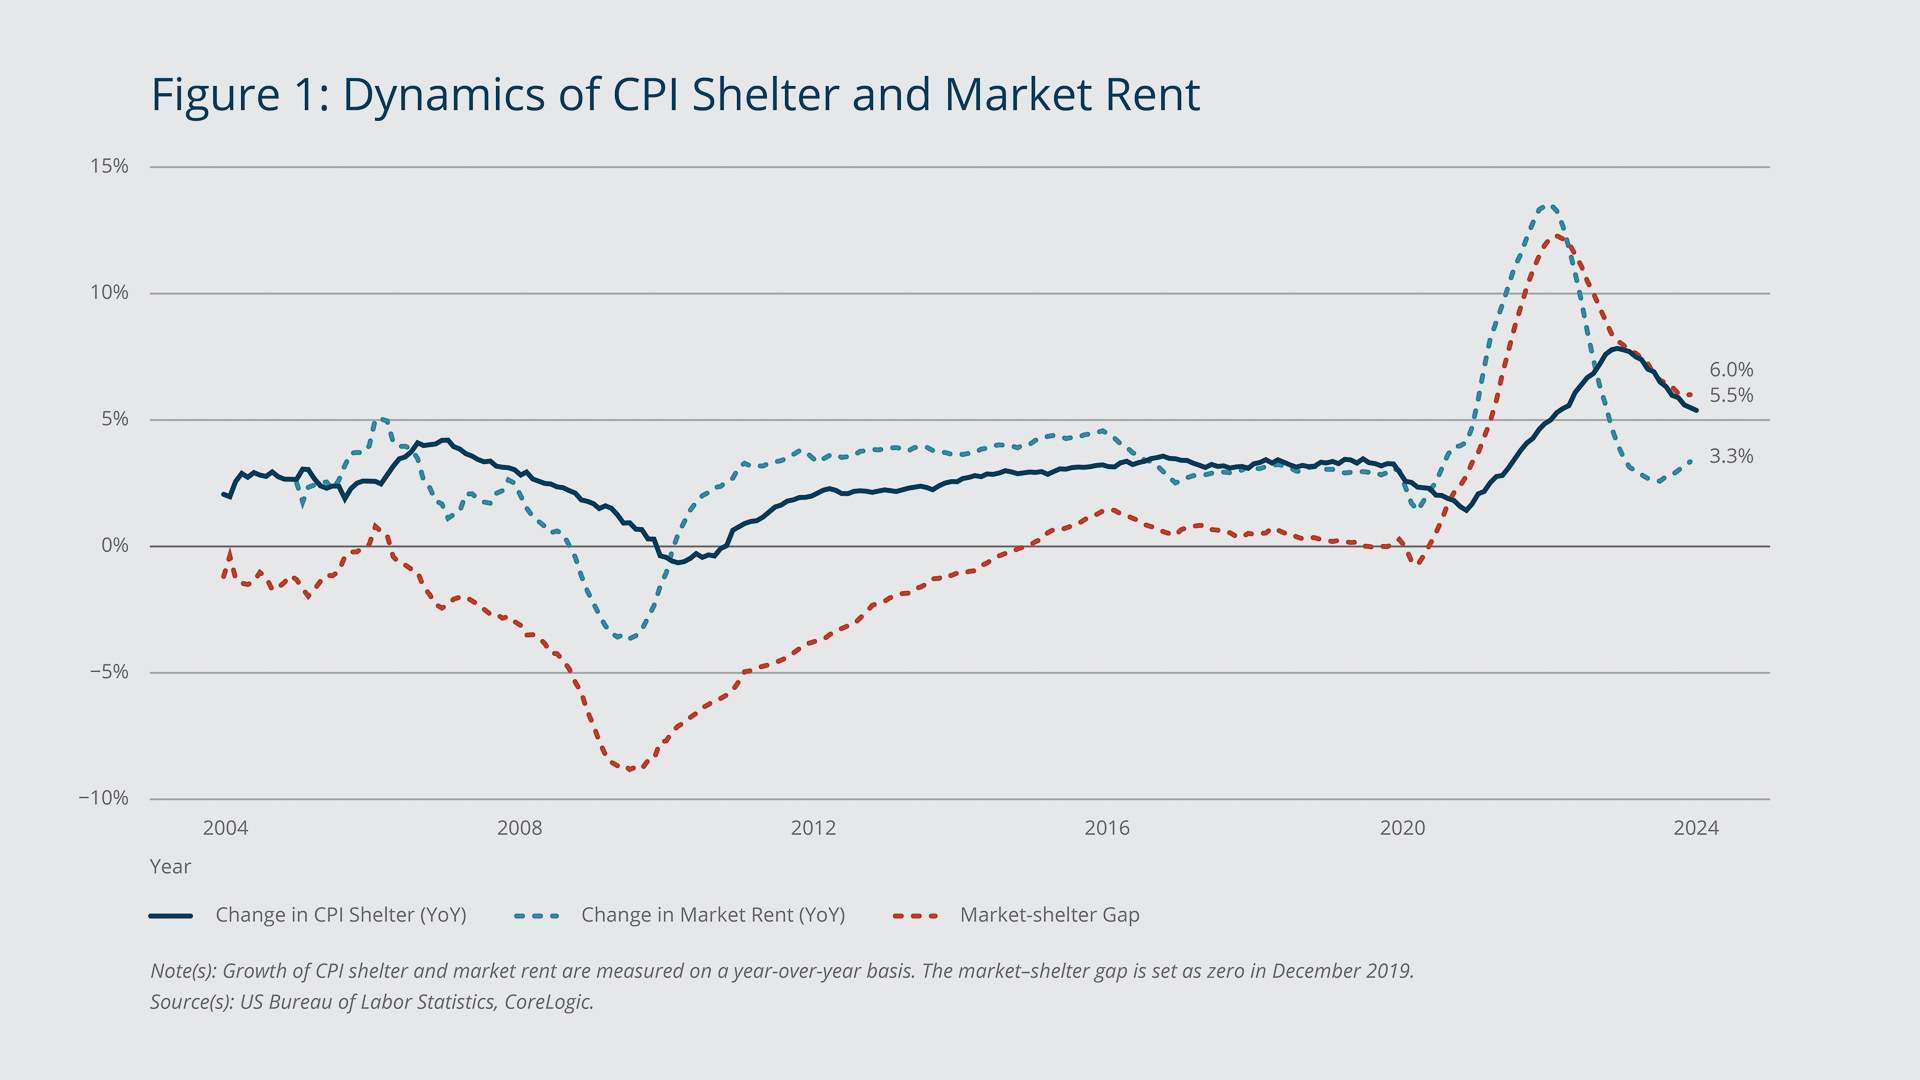
Figure 1 shows the dynamics of CPI shelter and market rent. The solid dark blue line depicts year-over-year growth of CPI shelter. The dashed light blue line shows year-over-year growth of market rent measured using data from CoreLogic, a company that provides real estate and consumer analytics, among other services. The dashed red line shows the market–shelter gap relative to December 2019.3
Federal Reserve Bank of Boston
Market rent rose sharply following the onset of the COVID-19 pandemic, peaking at a year-over-year rate of 13.6 percent in April 2022. The increase in CPI shelter was smaller and slower, reaching a year-over-year peak of only 7.8 percent and not until March 2023. As of March 2024, CPI shelter was continuing to catch up with market rent, growing 5.5 percent on a year-over-year basis, while market rent grew only 3.3 percent, which is similar to its pre-pandemic (from 2004 through 2019) average pace of 2.6 percent.
Despite this difference in growth rates, the market–shelter gap remained at 6.0 percent in March 2024, or 6.0 percentage points greater than it was in December 2019. If market rent continues to grow at a rate close to its pre-pandemic average, then CPI shelter must grow faster than its pre-pandemic average of 2.5 percent for this gap to close. The swift pace of CPI-shelter growth is an important factor slowing the disinflation process.
Historically, market–shelter gaps have closed slowly. During the Great Recession, for example, market rent contracted 2.9 percent from June 2007 to August 2009. Over the same period, CPI shelter grew 3.7 percent. As a result, the market–shelter gap expanded (in absolute terms) from –2.4 percent in June 2007 to –9.0 percent in August 2009. It took six years for this market–shelter gap to close. The gap was negative (instead of positive, as it is now), so it closed because CPI shelter grew more slowly than market rent over those six years.
The Pass-through of Market–Shelter Gaps Has Sped Up since the Pandemic
I estimate the speed at which the market–shelter gap has been passing through into CPI shelter in the post-pandemic period using a regression model applied to data for 21 metropolitan statistical areas (MSAs), a geographical area that encompasses a large city (or in some cases, adjacent large cities) and its suburbs. The model compares how much faster CPI shelter grows in MSAs that have larger market–shelter gaps versus MSAs that have smaller gaps. The CPI shelter data come from the US Bureau of Labor Statistics, and the market rent data come from CoreLogic.
Federal Reserve Bank of Boston
Figure 2 illustrates the market–shelter gap dynamics across MSAs over the last two decades. The market–shelter gap in each MSA is set to zero for December 2019. The dark blue line shows the median market–shelter gap for all MSAs in the sample. The light blue line shows the national market–shelter gap. The two measures move in a similar manner throughout the sample period. However, after 2020, the median MSA-level market–shelter gap becomes and remains smaller than the national gap. This may be because the MSA-level data cover large cities, and following the onset of the COVID-19 pandemic, rents grew slower in large cities relative to other areas. The blue- and orange-shaded areas show measures of dispersion of the MSA-level market–shelter gaps. The blue-shaded area shows the interquartile range. The orange-shaded area shows the 10th–90th percentile range.
The figure demonstrates the extent of the MSA-level variation, which allows the model to effectively identify how the size of a market–shelter gap affects the pass-through of that gap into CPI shelter. Using MSA-level data instead of national data enables the model to more precisely identify the impact of market–shelter gaps by looking at a much larger sample than what is available using national data from the short period since the end of the COVID-19 pandemic.4
Federal Reserve Bank of Boston
Figure 3 shows the estimated pass-through of market–shelter gaps into CPI shelter. The solid dark blue line shows the pass-through in the post-pandemic period (2021 through March 2024). The coefficient for the one-month-after period is 0.06, which implies that in the post-pandemic period, a 1 percentage point larger market–shelter gap is associated with CPI shelter growing an additional 0.06 percentage point over the following month. It also results in CPI shelter growing 0.15 percentage point more over the following three months, 0.27 percentage point more over the following six months, and 0.40 percentage point more over the following 12 months. In other words, if there is a positive market–shelter gap, then faster growth in CPI shelter closes 6 percent of that gap in the ensuing month, 15 percent in the next three months, 27 percent in the next six months, and 40 percent in the next 12 months.
This pace is much faster than that of the pass-through of market–shelter gaps into CPI shelter estimated in the period before the pandemic. The dashed light blue line in Figure 3 depicts the estimated pass-through for 2004 through 2020. It shows that a 1 percentage point larger market–shelter gap is associated with CPI shelter growing only an additional 0.03 percentage point over the next month, 0.07 percentage point more over the next three months, 0.12 percentage point more over the next six months, and 0.19 percentage point more over the next 12 months. Stated differently, when there was a positive market–shelter gap, faster growth in CPI shelter closed only 3 percent of that gap in the following month, 7 percent in the following three months, 12 percent in the following six months, and 19 percent in the following 12 months.
The dark-blue-shaded area in Figure 3 represents the 95 percent confidence interval for the post-pandemic coefficients; that is, we can be 95 percent confident that the post-pandemic coefficients lie in this area. The light-blue-shaded area represents the 95 percent confidence interval for the pre-pandemic coefficients. Because these two areas generally do not intersect, we can be reasonably confident that the pass-through of market–shelter gaps into CPI shelter has been faster in the post-pandemic period than it was before the pandemic.5
Gap Indicates CPI-shelter Growth Will Remain High While Slowing over the Coming Months
Figure 4 shows how the current market–shelter gap could affect month-over-month CPI-shelter growth from June 2024 to June 2025. To construct these estimates, I apply the coefficients from the regression model to the March 2024 market–shelter gap of 6.0 percent. The overall trend is clear: CPI shelter is expected to grow quickly in the summer and fall of 2024 but then slow down markedly when we move into 2025. Therefore, according to the estimates, the market–shelter gap is likely to pose a significant, but diminishing, challenge to the Fed’s ability to achieve its 2 percent inflation target over the next year.
Federal Reserve Bank of Boston
Holding everything else constant, I estimate that CPI shelter will grow an additional 1.6 percentage points from June 2024 to June 2025 as a result of the current market–shelter gap relative to if there were no gap. Note that these estimates assume that the rate of catch-up growth observed at the MSA level so far in the post-pandemic period is likely to continue at the national level.
Back-of-the-envelope calculations show how high CPI shelter could raise overall inflation this year. Given that shelter comprises 36.1 percent of the CPI and 15.5 percent of the PCE, the post-pandemic pass-through estimates imply that the current market–shelter gap will lead to an additional 0.59 and 0.25 percentage point growth in headline (including food and energy) CPI and headline PCE, respectively, from June 2024 to June 2025 relative to there being no market–shelter gap. The estimates also show that the deviation will lead to an additional growth in core (excluding food and energy) CPI and core PCE of 0.74 percentage point and 0.29 percentage point, respectively, from June 2024 to June 2025.
The current market–shelter gap, combined with the increased speed with which shelter prices have been catching up to market rent in the post-pandemic period, indicates that CPI-shelter growth will remain high through this summer and fall but then slow down. This growth would continue to hinder disinflation in 2024; however, the faster catch-up would quickly close the gap, which could result in slower CPI-shelter growth in future years.
The views expressed herein are solely those of the author and should not be reported as representing the views of the Federal Reserve Bank of Boston, the principals of the Board of Governors, or the Federal Reserve System.
Endnotes
- In the CPI and PCE, shelter prices include the monthly rent that tenants pay for their primary residence and owners’ equivalent rent, which is the monthly rent that homeowners would pay if they instead were tenants in their homes.
- See Bolhuis, Cramer, and Summers (2022), Cotton and O’Shea (2023), Kmetz, Louie, and Mondragon (2023), and Adams et al. (2022).
- I measure the market–shelter gap as the log of market rent minus the log of CPI shelter. I set this gap to be zero in December 2019. I choose this month because as Figure 1 shows, it followed several years in which market rent and CPI shelter were stable and the market–shelter gap was effectively unchanged. This choice also enables me to easily compare the pre-pandemic period with the present. An alternative would be to set the baseline as the average of the difference in logs of market rent and CPI shelter throughout my sample. However, the level of the market–shelter gap is only 0.3 percentage point higher in this case. In other words, I find that the market–shelter gap in March 2024 is 6.0 percent when compared with the value in December 2019 and 6.3 percent when compared with the historical average.
- I study the pass-through of the market–shelter gap into CPI shelter in more detail and considering all periods, not just the post-pandemic period, in Cotton (2024). The data set used in this memo and that paper are the same and are described in more detail in that paper. The market–shelter gap is captured by the difference in logs of market rent and CPI shelter. I study the differential effect of market–shelter gaps in the post-pandemic period by including an interaction between a dummy variable for the post-pandemic period and the difference in logs of market rent and CPI shelter. To capture aggregate effects, I control for time fixed effects. I also include MSA fixed effects to capture differences in the average growth of the dependent variables or the average of the explanatory variables across MSAs. I include 12 lags of the monthly difference in CPI shelter and market rent for the MSA to capture MSA-level differences in the future path of the dependent variables that are not due to the market–shelter gap. I follow the local projection approach suggested in Jordà (2005). I use Driscoll and Kraay (1998) standard errors, which allow for the possibility of heteroskedasticity, autocorrelation (I allow for a maximum of 11 lags), and correlation between groups.
- I conduct robustness checks to verify these results. I find that the pace of the post-pandemic pass-through appears reasonably similar to the baseline case and faster than the pre-pandemic pass-through when I change the controls I include in the regression, when I consider subsets of MSAs separately, when I set the post-pandemic period to begin in July 2021, and when I consider CPI rent and CPI owners’ equivalent rent separately instead of CPI shelter.
References
Adams, Brian, Lara Loewenstein, Hugh Montag, and Randal Verbrugge. 2022 “Disentangling Rent Index Differences: Data, Methods, and Scope.” US Bureau of Labor Statistics Working Paper 555.
Bolhuis, Marijn A., Judd N.L. Cramer, and Lawrence H. Summers. 2022. “Comparing Past and Present Inflation.” Review of Finance 26(5): 1073–1100.
Cotton, Christopher D. 2024. “The Pass-through of Gaps between Market Rent and the Price of Shelter.” Federal Reserve Bank of Boston Research Department Working Papers No. 24-6.
Cotton, Christopher D., and John O’Shea. 2023. “Forecasting CPI Shelter under Falling Market-rent Growth.” Federal Reserve Bank of Boston Current Policy Perspectives. February 16, 2023.
Driscoll, John C., and Aart C. Kraay. 1998. “Consistent Covariance Matrix Estimation with Spatially Dependent Panel Data.” Review of Economics and Statistics 80(4): 549–560.
Jordà, Òscar. 2005. “Estimation and Inference of Impulse Responses by Local Projections.” American Economic Review 95(1): 161–182.
Kmetz, Augustus, Schuyler Louie, and John Mondragon. 2023. “Where Is Shelter Inflation Headed?” Federal Reserve Bank of San Francisco Economic Letters 2023-19.

 About the Authors
Christopher D. Cotton,
Federal Reserve Bank of Boston
Christopher D. Cotton is an economist in the Federal Reserve Bank of Boston Research Department.
Email: [email protected]
Acknowledgments
The author thanks John O’Shea for excellent research assistance and Giovanni Olivei, Jenny Tang, and Egon Zakrajšek for very helpful suggestions and feedback.
Resources
Site Topics
Keywords
- CPI ,
- PCE ,
- shelter ,
- housing ,
- rent ,
- COVID-19 pandemic
JEL Codes
- E37 ,
- E31 ,
- E17
Citation
Cotton, Christopher D. 2024.“A Faster Convergence of Shelter Prices and Market Rent: Implications for Inflation.” Federal Reserve Bank of Boston Current Policy Perspectives No. 24-4.
Related Content
Understanding Inflation and the Implications for Monetary Policy: A Phillips Curve Retrospective
Forecasting CPI Shelter under Falling Market-Rent Growth
Faster Payments: Market Structure and Policy Considerations
Price Dispersion and Inflation: New Facts and Theoretical Implications