Productivity Improvements and Markup Normalization Can Support Further Wage Gains without Inflationary Pressures 


Federal Reserve Bank of Boston
The views expressed herein are solely those of the authors and should not be reported as representing the views of the Federal Reserve Bank of Boston, the principals of the Board of Governors, or the Federal Reserve System.
Wage inflation remains higher than it was before the onset of the COVID-19 pandemic, raising concerns that it could hinder progress toward a return of price inflation to the Federal Reserve’s 2 percent target. The impact of wage inflation on price inflation, however, cannot be considered independently of the behavior of productivity and firms’ markups. In that context, there are scenarios in which wage inflation could stay above trend for a few more quarters without contributing to higher price inflation.
Sign up for Research Department Updates.
As Figure 1 shows, the year-over-year change in the Employment Cost Index (ECI) stood at 4.1 percent as of March 2024; similarly, the year-over-year change in average hourly earnings was 4 percent in April. By contrast, both measures were close to 3 percent immediately before the start of the COVID-19 pandemic when inflation was roughly at target. Higher recent wage growth likely reflects firms’ need to align the wages of existing workers with market wages, which increased at a fast pace earlier in the recovery, when the competition for new hires was fierce. This “catch-up” process could take some time to play out, but it is likely that it eventually will be completed because wage growth for new hires has slowed markedly and returned to its pre-pandemic range. As shown in Figure 1, the Indeed Wage Tracker data, a proxy for the wages of new hires (job entrants and job switchers), indicate a decrease in the growth rate of new-hire wages from a year-over-year high of 9.4 percent in November 2021—near the beginning of the economic recovery from the pandemic—to 3 percent in April 2024.
Federal Reserve Bank of Boston
If wage growth for new hires remains contained, we expect to see a slow but steady return of overall wage inflation to its pre-pandemic level. The question then is whether this gradual moderation is consistent with price inflation returning to the Federal Reserve’s 2 percent target in a reasonable amount of time.
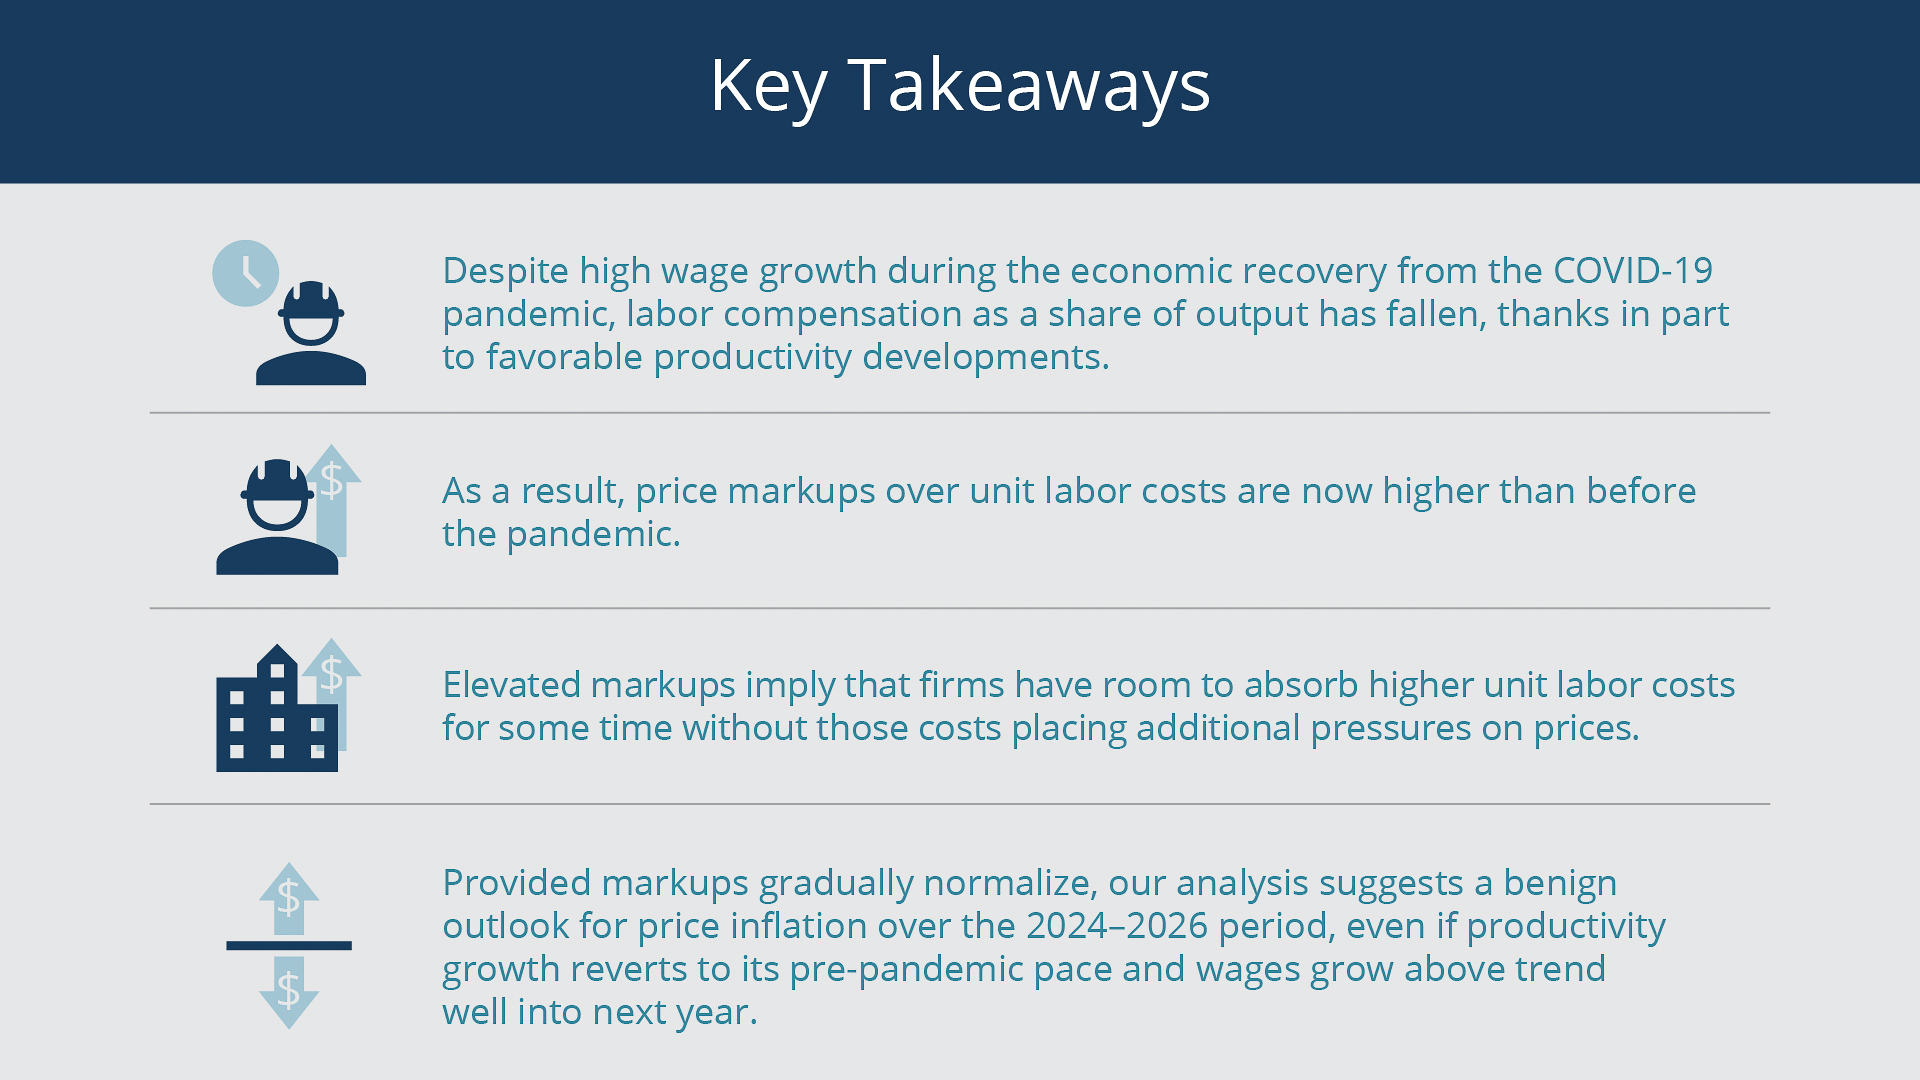
In this Current Policy Perspective, we argue that such an outcome is possible due to favorable developments in labor productivity during the pandemic that have enabled firms to increase their markups despite the increase in real wages. These elevated markups provide room for firms to absorb higher expected labor costs without putting upward pressures on prices—provided businesses are willing to return their markups to pre-pandemic levels. In fact, our results suggest that wages could grow above trend into 2025 without boosting price inflation, even if productivity growth falls back to its pre-pandemic pace.
Price Growth Has Outpaced Growth of Unit Labor Costs
In our analysis, prices are determined by a markup over unit labor costs.1 Unit labor costs equal labor compensation per hour adjusted for labor productivity (output per hour). For a given level of compensation per hour, unit labor costs will be lower if the productivity of labor is higher and higher if productivity is lower. Therefore, when assessing the potential effect of wages on prices, it is important to consider productivity developments. An increase in compensation per hour may not place upward pressures on prices if it comes with a commensurate increase in labor productivity. In addition, a change in unit labor costs does not have to be accompanied by an equivalent change in prices because firms can change their markups over time.
In the short run, markups can be volatile because most firms do not change prices frequently. Any change in unit labor costs that occurs between price resets is absorbed by an opposite change in markups; that is, if unit labor costs rise, markups will fall in the short run and vice versa. Moreover, even when firms do reset prices, they may choose not to fully pass through (or, offset) the change in unit labor costs. This decision may depend on how persistent firms expect the change to be; if they expect it will be short-lived, they may be less likely to reset prices. The decision may also depend on other factors such as the strength of demand; if demand is weak, firms may be reluctant to raise prices.2 Over the medium term, however, firms will likely want to keep their markups relatively stable, and therefore it is reasonable to expect a tighter relationship between prices and unit labor costs in that time frame.
Federal Reserve Bank of Boston
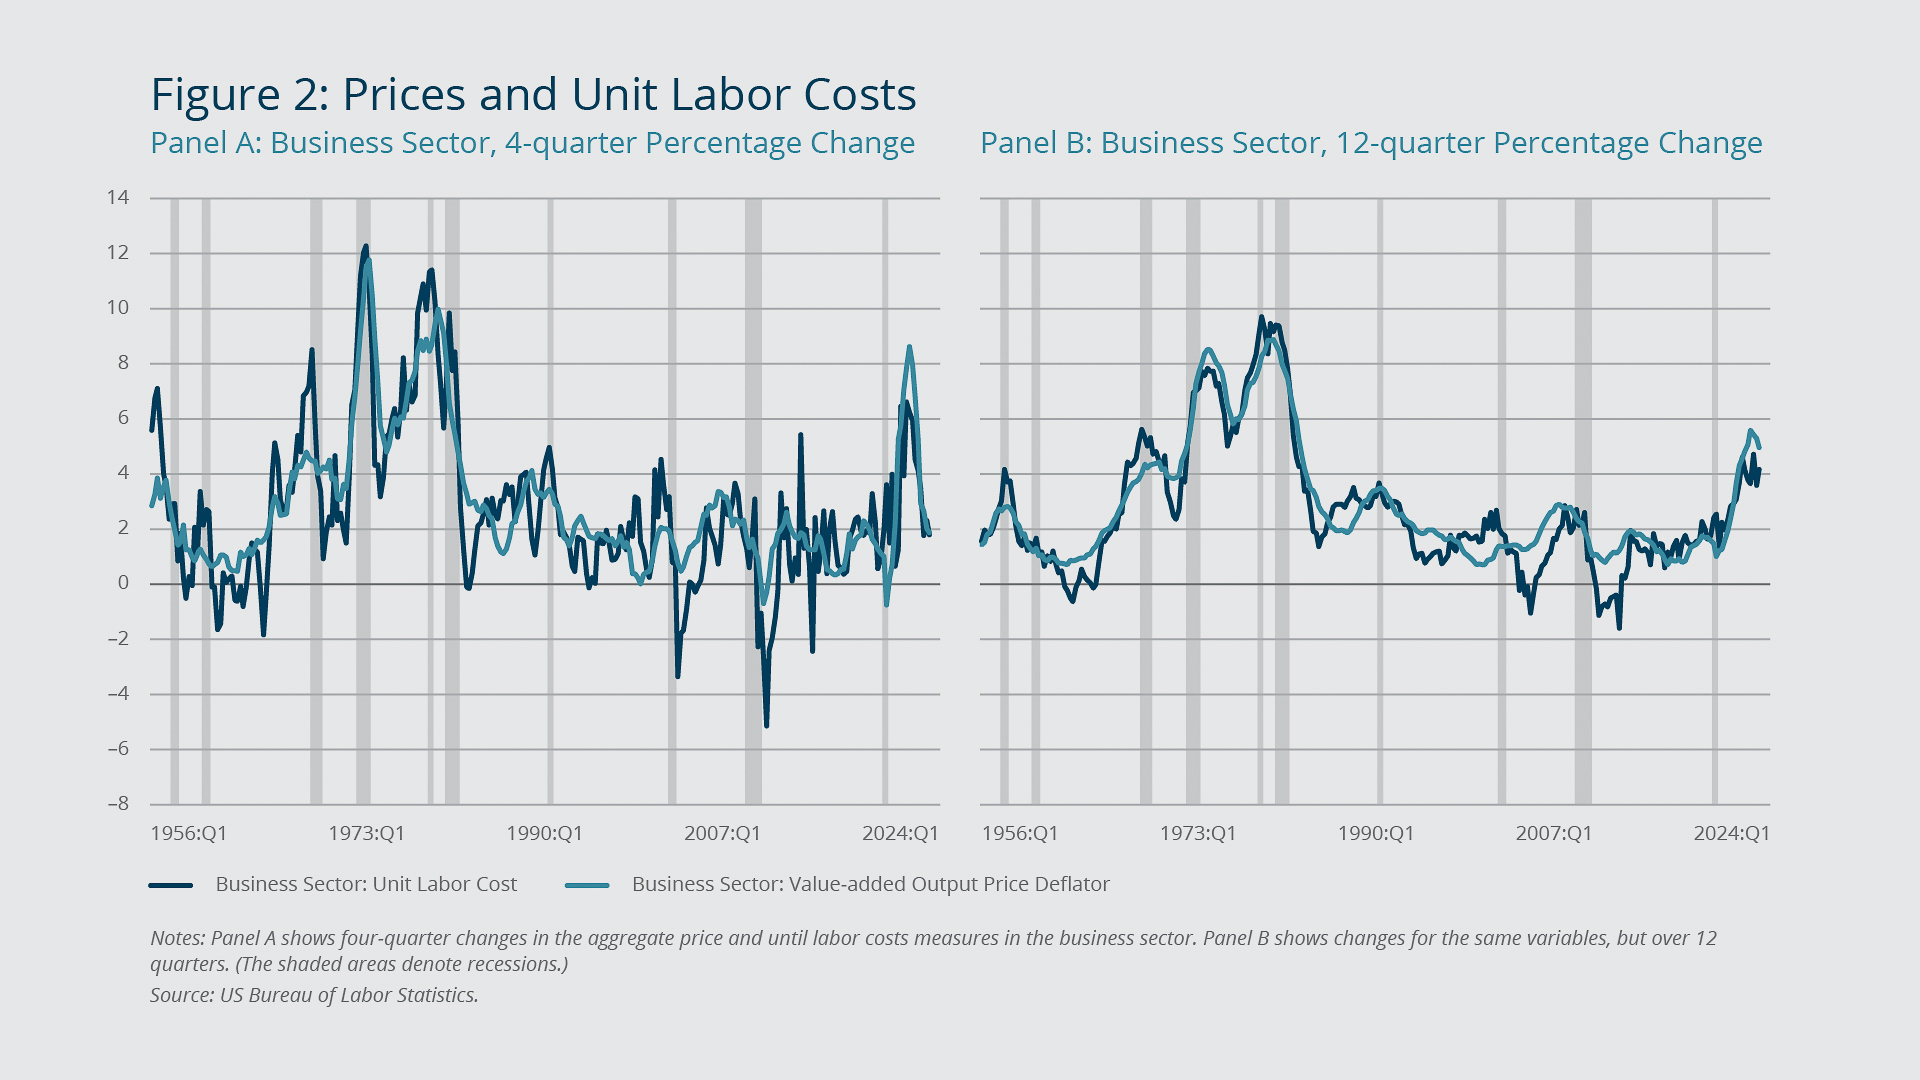
The data are broadly consistent with this observation. Figure 2A shows the four-quarter percentage change in the business sector’s aggregate measures of prices and unit labor costs. It is apparent that unit labor costs vary more than prices, consistent with the notion that markups fluctuate in the short run to absorb some of the variation in unit labor costs. The relationship between unit labor costs and prices becomes notably tighter, however, when 12-quarter (annualized) percentage changes are considered, as illustrated in Figure 2B. This tighter relationship over a longer period implies a tendency for markups to revert to their medium- to longer-run targeted values.
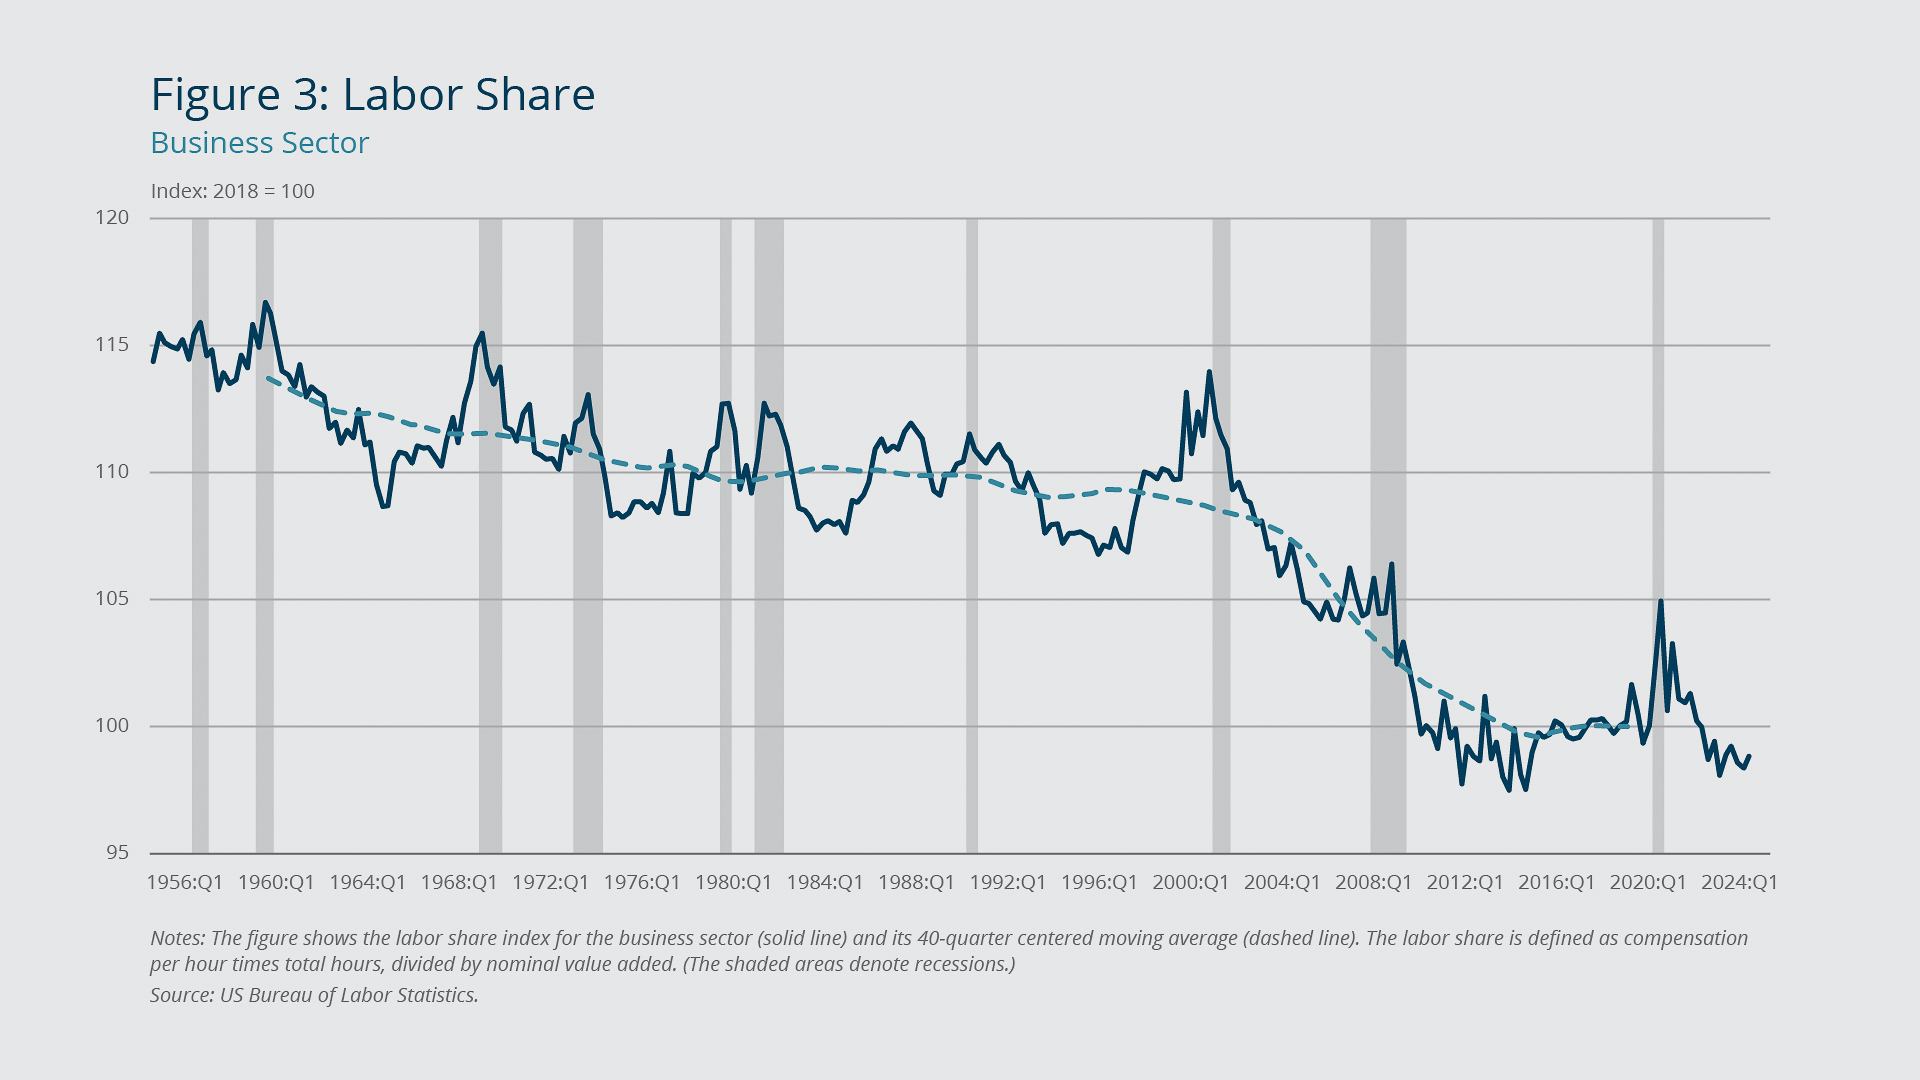
There can be exceptions to the preceding intuition; that is, the changes in prices and unit labor costs may not be one-to-one, even over longer periods of time. As a result, changes in markups occur not just in the short run but also in the medium and long term. This point is more easily illustrated using the labor share—the portion of output that accrues to workers in the form of compensation. In our setup, the labor share corresponds to the inverse of the markup of prices over unit labor costs. Therefore, a low labor share reflects a high markup and vice versa. Figure 3 illustrates instances of longer-term changes in the labor share. It shows a modest but steady downward trend for the business sector’s labor share in the first part of the sample period, then a pronounced decline during the 2000s, followed by relative stability during the recovery after the Great Recession.
Federal Reserve Bank of Boston
The broader trend of a declining labor share (or, equivalently, increasing markups) has been widely studied in the literature. The research identifies many, non-mutually exclusive, potential drivers for the decline, including technological advances embodied in capital inputs, an increase in automated production processes, globalization and the rise of China, a decline in workers’ bargaining power, and firms’ greater pricing power due to increased market concentration.3 Also, there are measurement issues associated with the labor share that can affect inferences about the extent to which it has changed over time.4 The relative stability of the labor share in the 2010s suggests that some of the factors contributing to its decline over the preceding decade might have run their course to a large extent.
As for the most recent movements in the labor share, some of the fluctuations shortly after the onset of the pandemic were driven by changing industry composition due to the closing and subsequent reopening of the economy. But as the health emergency subsided, the labor share fell, and it is now roughly 1.5 percent below its 2018 level. In other words, from the beginning of the pandemic through the end of 2023, prices grew faster than unit labor costs in the business sector.
Federal Reserve Bank of Boston
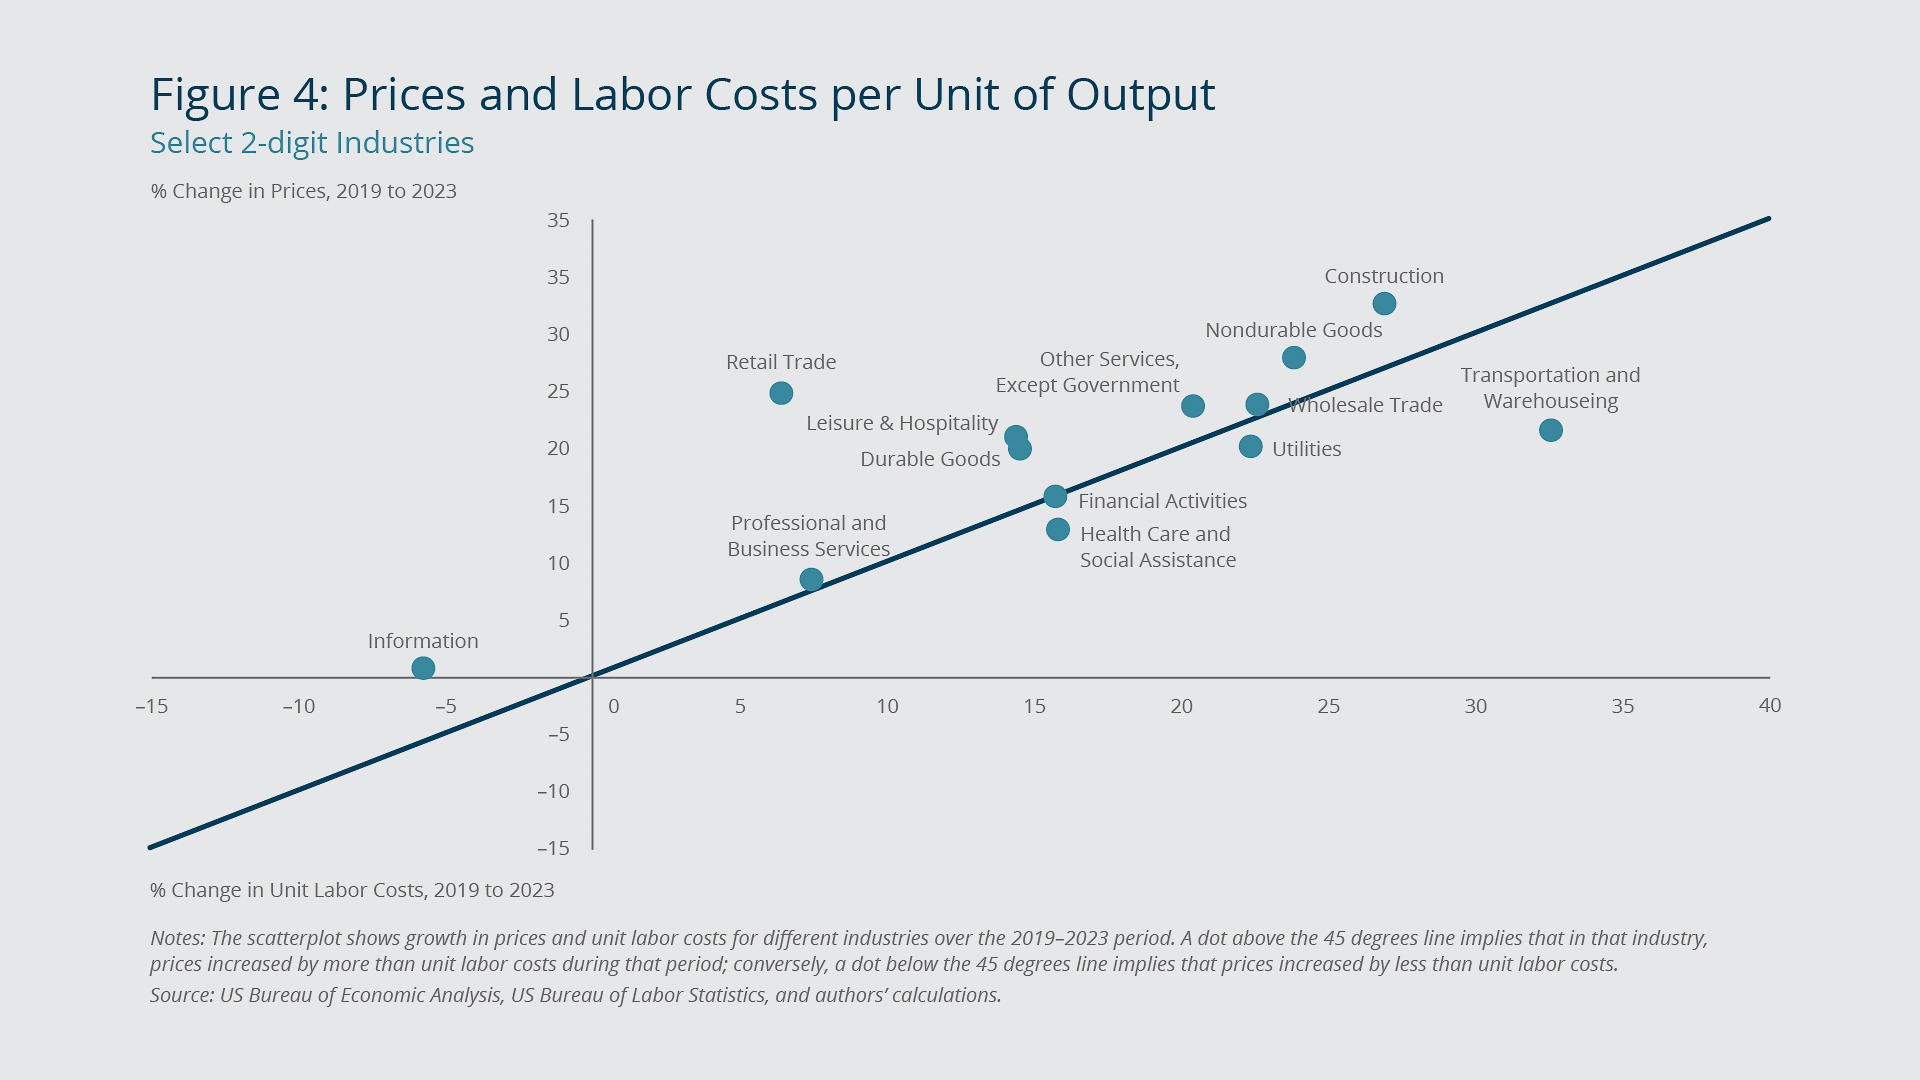
This pattern is evident also at a more disaggregated level. Figure 4 shows the cumulative increases in prices and unit labor costs on the vertical and horizontal axes, respectively, over the 2019–2023 period for major industries.5 Most of the industries lie above the 45 degrees line, meaning that their prices have grown by more than their unit labor costs. Those industries account for approximately 75 percent of employment across all the industries included in the figure.
Historical Dynamics of Prices, Wages, and Productivity in Response to Labor Share Fluctuations
What can be expected in terms of the behavior of prices, wages, and labor productivity going forward given the recent developments in the labor share? To answer this question, we assess first the joint dynamics of prices, wages, and productivity from 2010 through 2019.6 We choose this period because the labor share was relatively stable—a prerequisite for the empirical framework we use—and because the sample period is recent, potentially making it more relevant for assessing the current episode.
The main takeaway from this exercise is that all three variables we consider contributed to re-equilibrating the labor share over the 2010–2019 period. In other words, whenever the labor share was below its longer-run level, restoring the longer-run value of the labor share entailed—all else being equal—lower price inflation, higher wage inflation, and lower labor productivity growth going forward. The estimates apply symmetrically to when the labor share was above or below its longer-run level. They also imply that it takes about 12 quarters to close a large fraction of a given deviation of the labor share from its longer-run level, with productivity shouldering the greatest portion of the adjustment, followed by prices then wages.7
For this exercise, we used quarterly industry data from the US Bureau of Economic Analysis that enable us to exploit variation across industries in addition to variation over time.8 With these data, we also can account for common macroeconomic factors such as monetary and fiscal policies that can affect the behavior of prices, wages, and productivity across industries over time. However, a disadvantage of this approach is that it constrains all industries to display the same dynamics in terms of how their prices, wages, and labor productivities adjust to re-equilibrate the labor share.9
Implications for the Future Behavior of Prices, Wages, and Productivity
We use the estimates from the 2010–2019 period to extrapolate the behavior of price inflation, wage inflation, and productivity growth from 2024 through 2026. The results from our simulation are consistent with a benign outlook for price inflation despite productivity growth reverting to its lower, pre-pandemic trend pace and wages growing above trend on a four-quarter basis well into next year.10
As noted, our simulation reflects the relative stability of the labor share over the 2010–2019 period and assumes that the longer-run level of the labor share is currently the same as the one prevailing in 2018, when labor market conditions were likely neither too loose nor too tight. The overarching implication of this assumption is that prices will grow at a slower pace than unit labor costs over the simulation period to lift the labor share and bring it closer to its 2018 longer-run value. In other words, firms are expected to absorb a portion of the increase in unit labor costs by reducing their markups.
Federal Reserve Bank of Boston
Figure 5A shows the simulation results. Figure 5B illustrates the associated path for the business sector’s labor share.11 In this exercise, business-sector price inflation runs slightly above 2 percent in the near term; the implied year-over-year change at the end of 2024 is about 2.3 percent. Wages grow faster than their longer-run 3 percent pace over the course of this year, even with productivity growth returning to its longer-run rate of 1 percent. Given these dynamics, the labor share gradually returns to its 2018 value.
Again, the simulation results hinge on the longer-run labor share—and therefore, markups—being about the same as it was in 2018. If the longer-run labor share has instead decreased (or, equivalently, markups have increased), there would be less room for unit labor costs to increase without putting additional pressures on prices.
Prospects for inflation clearly also depend on how unit labor costs evolve going forward. The interplay between productivity and wage developments will pin down the dynamics of unit labor costs. Labor productivity in the business sector has grown, on average, at a relatively fast pace recently. However, as noted, our simulation treats this growth spurt as temporary, even though the projection for this year calls for above-trend growth. Whether there is room for labor productivity growth to remain higher than what is suggested in the simulation is beyond the scope of this study.
Federal Reserve Bank of Boston
Labor productivity improvements since the pandemic have been more pronounced in the services-producing industries, as Figure 6 shows.12 At least in some of those industries, firms have had difficulty finding workers and have, therefore, focused on using available resources more efficiently.13 But there is likely a limit to that practice, suggesting that the recent favorable labor productivity developments represent a level shift rather than a persistent increase in the rate of growth.
Other plausible reasons why productivity improved in some service industries during the pandemic era, such as relatively easier transition to remote work, carry the same implication that the gains are most likely in levels instead of growth rate.14 On the other hand, the upward level shift in productivity could still be ongoing, even apart from the potentially substantial additional productivity lift that may result from the most recent major breakthroughs in artificial intelligence (AI).15 Obviously, how much AI may raise the level of labor productivity and the period over which this may happen remain uncertain. Nevertheless, an outlook for labor productivity growth that is better than what the simulation assumes would provide even more room for wages to grow without placing additional pressures on prices.
This discussion highlights the role of productivity growth in determining the interplay between wage and price inflation and the considerable uncertainty about the path of wage inflation that would be consistent with price inflation reverting to the Fed’s 2 percent target in a reasonable amount of time. Our simulation results hinge on firms’ willingness to accept the pre-pandemic, somewhat lower markups—a scenario that is more likely if demand moderates. At the same time, productivity developments that are more favorable than those assumed in the simulation could support a delay in markup adjustments, helping to prevent higher inflation over the forecast horizon.
Endnotes
- The standard definition of markup is price over marginal cost, while here it is defined as price over average cost.
- For a survey of the factors that firms deem most important in their pricing decisions and the role played by demand and desired markups, see de Bruin et al. (2023).
- See Grossmann and Oberfeld (2022) for a review of the extensive literature on the potential explanations for a declining labor share.
- See, for example, Elsby, Hobijn, and Sahin (2013).
- The industries are based on the two-digit level of the North American Industry Classification System (NAICS). We do not consider the following industry groups: agriculture, forestry, fishing, and hunting; mining; educational services; and government. This is due to data availability and to prices being set in commodities markets for some of these industries.
- For an analysis based on this same framework but using international data, see Mojon, Nodari, and Siviero (2023).
- Uncertainty around the estimates, however, is high given that the sample remains relatively small even when exploiting variation across industries.
- Because our sample period is relatively short, we use two-digit industry data rather than relying on the limited number of aggregate observations. We rely on data at the quarterly frequency for the inference, using gross output and price data by two-digit industry from the BEA GDP by Industry tables in the national accounts. The BEA, however, provides industry-level compensation and hours at only an annual frequency. Therefore, we proxy those variables with sectoral average hourly earnings and total hours worked from the US Bureau of Labor Statistics Current Employment Statistics (CES) survey.
- We model the quarterly dynamics for the (log) change in prices, productivity, and wages by industry as functions of past quarterly changes in those variables and the previous period (log) level of the labor share. In other words, our estimation method is an error-correction model applied to panel data, and we include industry fixed effects and a common time fixed effect across industries. By doing so, we allow for prices, productivity, and wages to adjust in response to deviations of the labor share from its (industry-specific) longer-run level while also allowing for the speed of adjustment to differ across the three variables.
- These results are consistent with the findings in Andrade et al. (2024).
- The simulation uses the realized values for the growth of prices, productivity, and wages in the business sector over 2023 as initial conditions and projects their values going forward.
- The figure shows value added per hour (where hours are from the CES survey) rather than gross output per hour. However, when we instead use gross output, the main takeaway that labor productivity developments since the pandemic outbreak have been more favorable in services-producing industries than in goods-producing industries still holds.
- Given the general difficulty in measuring the quality of output in service sectors, it is possible that the true quantity of output during the pandemic may have been overstated because some firms reduced their service quality to cope with labor shortage, as suggested by anecdotal evidence.
- For example, Fernald and Li (2022) note that industries where remote work was more feasible and widely adopted exhibited greater improvement in productivity growth during the pandemic through 2022:Q1. Eberly, Haskel, and Mizen (2021) attribute the productivity acceleration in those industries to their higher share of existing intangible capital, which enabled them to adapt to the new mode of work with alacrity. But productivity growth in those tele-workable industries appears to have declined after late 2022.
- It is unlikely that AI and generative AI (GenAI) are already affecting observed aggregate productivity data because major breakthroughs in GenAI did not become readily usable until late 2022. Given the general-purpose-technology nature of such AI tools, their adoption could lead to substantial and broad-based gains in productivity for the foreseeable future, as suggested by past episodes of major advances in general purpose technologies such as electricity and the internet. (See, for example, Gordon 2015.)
References
Andrade, Philippe, Falk Bräuning, Jose L. Fillat, and Gustavo Joaquim. 2024. “Is Post-Pandemic Wage Growth Fueling Inflation?” Federal Reserve Bank of Boston Research Paper Series Current Policy Perspectives Paper No. 2024-1.
De Bruin, Wändi Bruine, Keshav Dogra, Sebastian Heise, Edward S. Knotek II, Brent H. Meyer, Robert W. Rich, Raphael S. Schoenle, Giorgio Topa, and Wilbert van der Klaauw. 2023. “How Do Firms Adjust Prices in a High Inflation Environment?” Federal Reserve Bank of New York. Liberty Street Economics (blog). June 2. https://libertystreeteconomics.newyorkfed.org/2023/06/how-do-firms-adjust-prices-in-a-high-inflation-environment/
Eberly, Janice C., Jonathan Haskel, and Paul Mizen. 2021. “‘Potential Capital,’ Working from Home, and Economic Resilience.” National Bureau of Economic Research Working Paper 29431. https://www.nber.org/papers/w29431
Elsby, Michael, Hobijin, Bart, and Sahin, Aysegül. 2023. “The Decline of the U.S. Labor Share.” Brookings Papers on Economic Activity Fall: 1–63. https://www.brookings.edu/wp-content/uploads/2016/07/2013b_elsby_labor_share.pdf
Fernald, John and Huiyu Li. 2022. “The Impact of COVID on Productivity and Potential Output.” Jackson Hole Symposium, Federal Reserve Bank of Kansas City. https://www.kansascityfed.org/Jackson%20Hole/documents/9672/JH2022_Fernald.pdf
Gordon, Robert J. 2015. “Secular Stagnation: A Supply-Side View.” American Economic Review 105(5): 54–59. https://www.aeaweb.org/articles?id=10.1257/aer.p20151102
Grossman, Gene M. and Oberfield, Ezra. 2022. “The Elusive Explanation for the Declining Labor Share.” Annual Review of Economics (14): 93–124. http://dx.doi.org/10.1146/annurev-economics-080921-103046
Mojon, Benoit, Gabriela Nodari, and Stefano Siviero. 2023. “Disinflation Milestones.” BIS Bulletin No. 75. https://www.bis.org/publ/bisbull75.pdf

 About the Authors
Vaishali Garga,
Federal Reserve Bank of Boston
Vaishali Garga is an economist in the Federal Reserve Bank of Boston Research Department.
Email: [email protected]
Giovanni P. Olivei,
Federal Reserve Bank of Boston
Giovanni P. Olivei is a senior vice president and deputy director of research at the Federal Reserve Bank of Boston.
Email: [email protected]
J. Christina Wang,
Federal Reserve Bank of Boston
J. Christina Wang is a senior economist and policy advisor in the Federal Reserve Bank of Boston Research Department.
Email: [email protected]
Acknowledgments
Resources
Site Topics
Keywords
- wage inflation ,
- productivity
JEL Codes
- E31 ,
- E24 ,
- E39
Citation
Garga, Vaishali, Giovanni P. Olivei, and J. Christina Wang. 2024. “Productivity Improvements and Markup Normalization Can Support Further Wage Gains without Inflationary Pressures.” Federal Reserve Bank of Boston Current Policy Perspectives 24-5.