New England Economic Conditions through July 9, 2024 


Key Takeaways
- In May 2024, New England’s employment grew at a year-over-year rate of 1 percent, which was close to the rate observed before the onset of the COVID-19 pandemic. Among all supersectors in New England, educational and health services had the highest growth rate, at more than 3 percent, from May 2023 to May 2024. By contrast, the information sector experienced a 3.7 percent decrease in employment, the largest decline over that period.
- New England’s unemployment rate increased 0.4 percentage point from May 2023 to May 2024; but at 3.4 percent, the regional rate was still lower than the US rate of 4.0 percent. The rate increase in New England was likely driven in part by a rise in labor force participation. As more people joined the labor force, some might not have been able to immediately find a job and therefore became unemployed.
- House prices in New England grew faster than those in the country as a whole from 2023:Q1 to 2024:Q1. However, the office market remained soft both in the Boston area and across the country, with rising vacancy rates and stagnant rents.
- The year-over-year change in the Consumer Price Index for Boston rose from 2 percent for January 2024 to 4 percent for May 2024. This increase was mostly driven by a 7.7 percent rise in shelter prices, which was only partially offset by a 3.5 percent decline in prices for fuels and utilities.
Sign up for new research and data on the New England economy.
Payroll Employment
- In May 2024, New England’s employment continued to grow at a year-over-year rate that was lower than the national rate but close to the regional rate before the COVID-19 pandemic.
- The educational- and health-services sector in New England grew more than 3 percent from May 2023 to May 2024, while the information sector lost 3.7 percent of its employment over that one-year period.
- Job openings rates in the region continued trending downward in April 2024, but they were similar to or somewhat higher than the rates for February 2020. Most of the New England states saw an increase in the rate of layoffs and discharges compared with 12 months prior.
Since late 2021, year-over-year employment growth for New England has been trending gradually downward (Exhibit 1). The New England rate dropped from 4.9 percent for December 2021 to 1.0 percent for May 2024. Nevertheless, it was still higher than its 30-year moving average rate of 0.8 percent and was close to the level seen right before the COVID-19 pandemic. Each state in the region posted an increase in employment for May 2024 compared with a year prior. State-level year-over-year employment growth ranged from 0.6 percent for Massachusetts to 1.9 percent for Vermont.
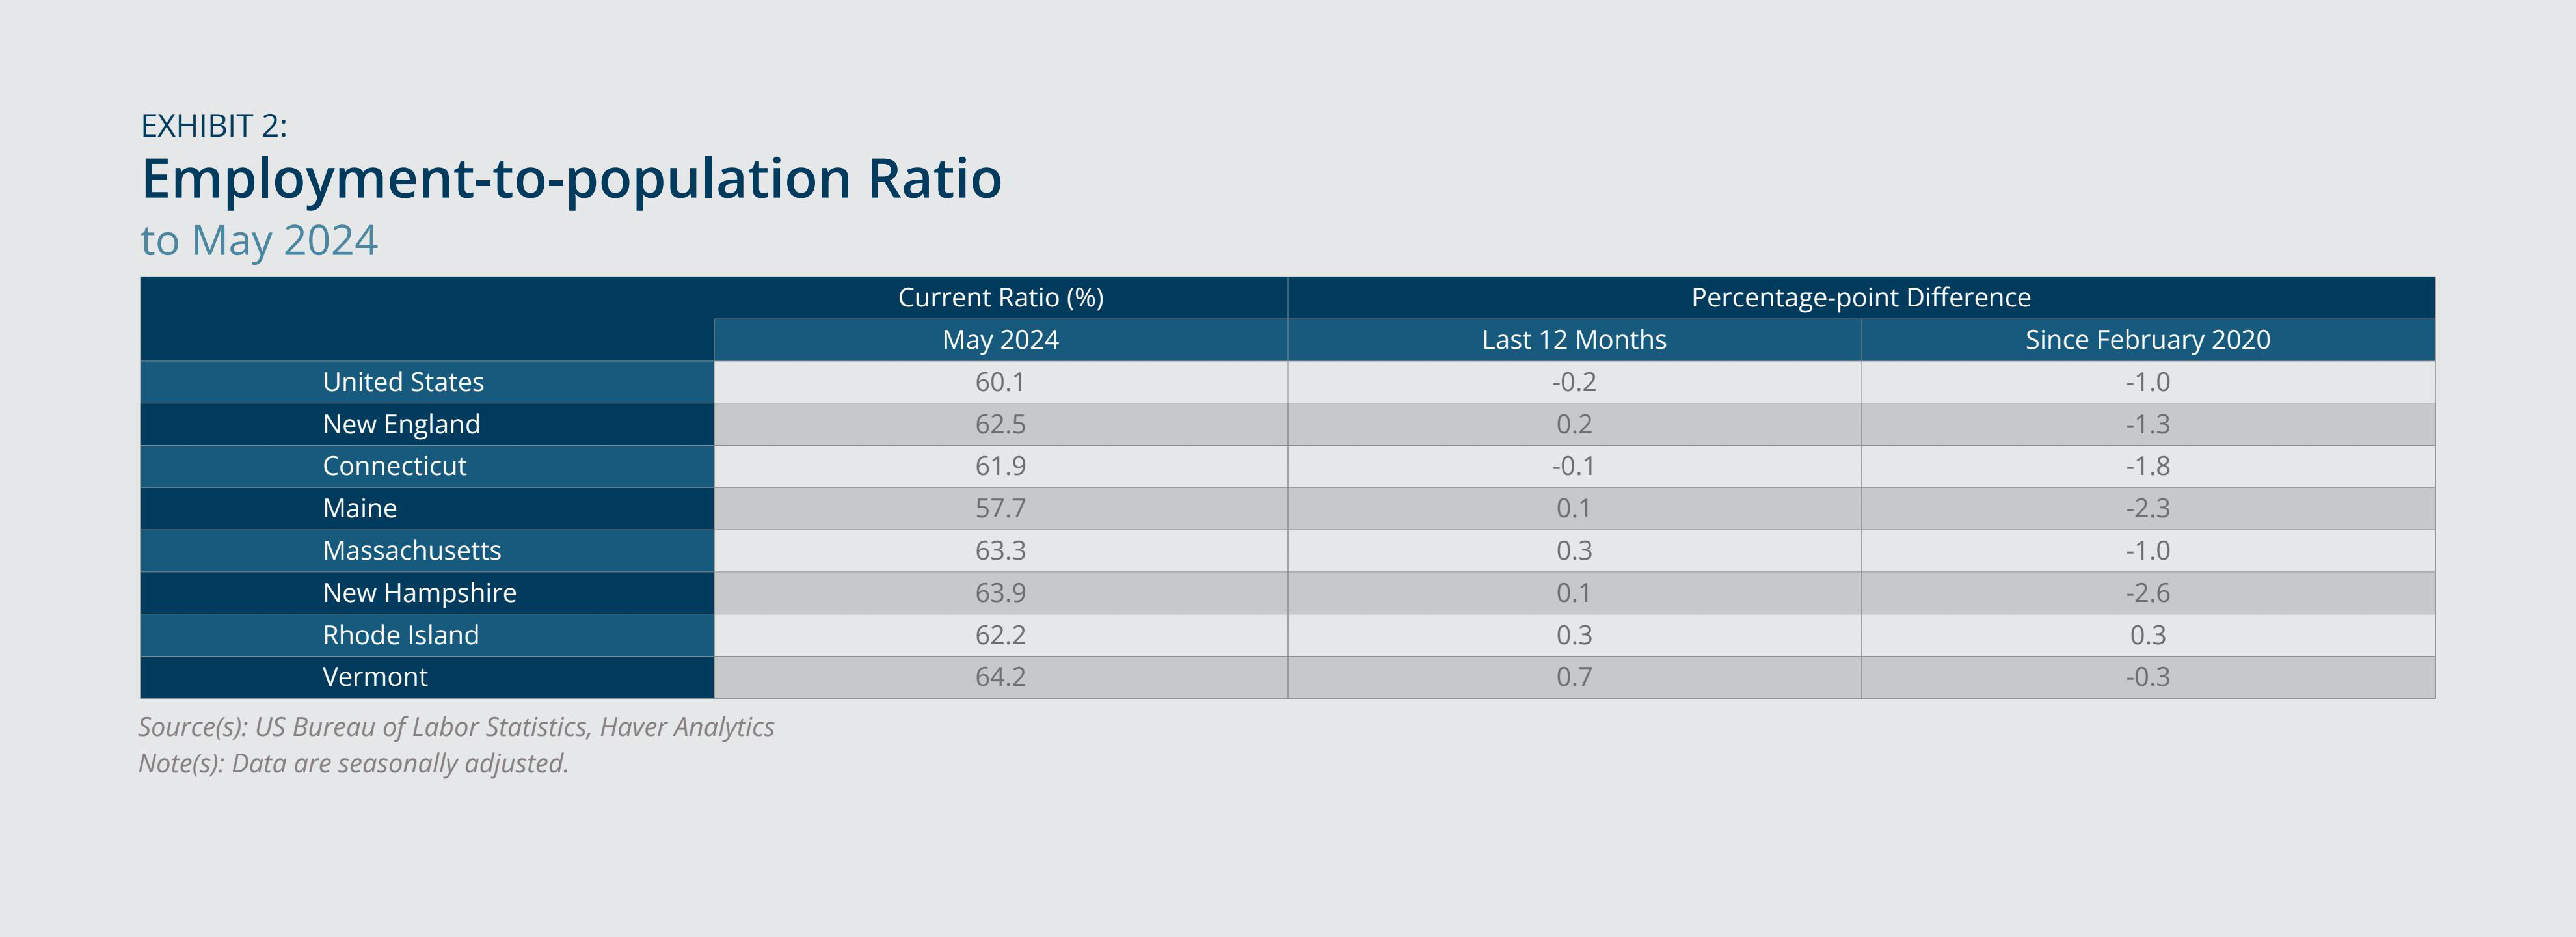
While regional employment growth was slower than national employment growth, that trend is consistent with the historical norm. The regional rate was generally lower than the national rate in the period before the pandemic, as shown in Exhibit 1. New England’s 30-year moving average rate is also less than the US 30-year moving average rate. The slower regional employment growth is partly driven by population growth that is slower than the national rate. On balance, New England’s employment-to-population ratio is higher than the US ratio by 2.4 percentage points (Exhibit 2). It increased 0.2 percentage point from a year prior, while the national ratio decreased 0.2 percentage point over the same 12-month period.
The educational- and health-services sector led all supersectors in New England with an increase of more than 3 percent from May 2023 to May 2024 (Exhibit 3). The supersector’s growth was driven mostly by a 3.7 percent increase in health-care and social-assistance employment, while employment in educational services increased only 0.8 percent during the same period. On the other end of the spectrum, the information sector lagged the most over that period, with a 3.7 percent loss. This sector has been going through significant downsizing across the region since early 2023. For example, Gannett laid off many journalists working for local newspapers in Brockton, Massachusetts, and Providence, Rhode Island. It also closed nearly 20 weekly newspapers in Massachusetts and consolidated the rest in the state into a small number of digital media outlets.1
Since 2022, job openings rates have been trending downward both in the region and across the country (Exhibit 4). The United States and each New England state saw a decrease in its openings rate from April 2023 to April 2024. The April 2024 rates were still somewhat higher than the February 2020 rates, except in Vermont, where the latest rate was equal to the pre-pandemic rate.
All the New England states except Massachusetts saw a hike in the layoffs and discharges rate for April 2024 compared with a year earlier (Exhibit 5). By contrast, the United States experienced a slight year-over-year decrease in the layoffs and discharges rate.

Federal Reserve Bank of Boston
Federal Reserve Bank of Boston
Federal Reserve Bank of Boston
Federal Reserve Bank of Boston
Federal Reserve Bank of Boston
Household Employment
- New England’s unemployment rate for May 2024 was higher than a year earlier but lower than the national rate for the same month.
- The labor force participation rate for New England increased from a year ago, which likely contributed to the rise in the unemployment rate.
New England and the United States both saw their unemployment rates increase from May 2023 to May 2024, by 0.4 and 0.3 percentage point, respectively (Exhibit 6). The regional unemployment rate remained lower than the national rate. Massachusetts was the only New England state with a lower unemployment rate compared with a year earlier. For May 2024, Vermont and New Hampshire had the third- and fourth-lowest unemployment rates in the country, respectively.2 Conversely, Connecticut and Rhode Island were among the states with the 10 highest unemployment rates in the country that month.
Labor force participation in New England improved from 64.2 percent for May 2023 to 64.7 percent for May 2024 (Exhibit 7). This growth likely contributed to the increase in the regional unemployment rate, as more people joined the labor force, but some might not have been able to immediately find a job. Each state in the region saw improvement in labor force participation during that period; however, the US rate dipped 0.1 percentage point.
Federal Reserve Bank of Boston
Federal Reserve Bank of Boston
Real Estate Markets
- Compared with the country as a whole, New England saw stronger year-over-year house-price growth for 2024:Q1.
- The office vacancy rate continued to rise in both downtown and suburban Boston, while office rent has remained relatively flat since 2023.
House prices in the United States continued to grow in 2024:Q1, with all 50 states experiencing a year-over-year appreciation (Exhibit 8). The Federal Housing Finance Agency (FHFA) attributed the house-price growth to a low inventory of houses on the market.3 The New England region saw stronger house-price growth compared with the nation. In fact, Vermont claimed the No. 1 spot nationwide with a year-over-year increase of 12.8 percent.
By contrast, the office market continued to be challenging both in the Boston area and across the country. In Boston and the United States, the downtown and suburban office vacancy rates were higher in 2024:Q1 than they were in 2023:Q4 and in 2023:Q1 (Exhibit 9). However, Boston’s downtown and suburban rates remained lower than the corresponding rates for the United States. Rising vacancy rates put downward pressure on office rents. As a result, Boston office rents increased less than 0.7 percent from 2023:Q1 to 2024:Q1, while US office rents grew even slower, at 0.3 percent in suburban markets and 0.5 percent in downtown markets (Exhibit 10).
Federal Reserve Bank of Boston
Federal Reserve Bank of Boston
Federal Reserve Bank of Boston
Inflation
- Boston’s overall inflation jumped to 4 percent for May 2024, reversing the downward trend observed for late 2022 and all of 2023.
- Shelter prices in Boston increased 7.7 percent, while prices for fuels and utilities decreased 3.5 percent.
Overall inflation in Boston has been on a trajectory that is different from the path of US inflation since the beginning of 2024 (Exhibit 11). In contrast to the steady decline from September 2022 to January 2024, the year-over-year change in the Consumer Price Index (CPI) for Boston increased from 2 percent for January 2024 to 4 percent for May 2024. The year-over-year growth in the CPI for the United States was relatively stable during the January 2024–May 2024 period. As a result, Boston’s overall inflation was 0.7 percent higher than the US rate in May 2024.
A large year-over-year increase in Boston’s shelter prices outweighed a decline in prices for fuels and utilities in the area (Exhibit 12). Shelter prices in Boston increased 7.7 percent on a year-over-year basis, while prices for fuels and utilities dropped 3.5 percent, driven by a 9.4 percent decrease in electricity prices.4
Federal Reserve Bank of Boston
Federal Reserve Bank of Boston
Endnotes
- See Molly Farrar, “Gannett Closing Local Newsrooms in Latest Cost-cutting Measure.” Boston.com, March 17, 2024. https://www.boston.com/news/media/2024/03/17/gannett-closing-local-newsrooms-in-latest-cost-cutting-measure/
- US Bureau of Labor Statistics, Local Area of Unemployment Statistics, https://www.bls.gov/web/laus/laumstrk.htm (accessed July 5, 2024).
- Federal Housing Finance Agency, “U.S. House Prices Rise 6.6 Percent over the Last Year; Up 1.1 Percent from the Fourth Quarter of 2023,” news release, May 28, 2024, https://www.fhfa.gov/news/news-release/u.s.-house-prices-rise-6.6-percent-over-the-last-year-up-1.1-percent-from-the-fourth-quarter-of-2023.
- For information about these subcategories, see US Bureau of Labor Statistics, “Consumer Price Index, Boston-Cambridge-Newton—May 2024,” https://www.bls.gov/regions/northeast/news-release/ConsumerPriceIndex_Boston.htm (accessed July 5, 2024).

 About the Authors
Bo Zhao,
Federal Reserve Bank of Boston
Email: [email protected]
Acknowledgments
Kelly Jackson, Federal Reserve Bank of Boston
Gregory Longfield, Federal Reserve Bank of Boston
Nathaniel Nelson, New England Public Policy Center, Federal Reserve Bank of Boston
Resources
Keywords
- Regional economy ,
- Economic Conditions ,
- New England