1997 RECS Survey Data 2020 | 2015 |2009 | 2005 | 2001 | 1997 | 1993 | Previous
- Housing characteristics
- Consumption & expenditures
- Microdata
- Methodology
Consumption & Expenditures Tables
| Table Titles | Consumption | Expenditures |
|---|---|---|
| Tables: CE1 Total Energy Consumption in U.S. Households | ||
| Tables: CE2 Space Heating in U.S. Households | ||
| NOTE: As of 5/5/00, the "heated square footage" and "intensities" numbers were revised and will differ from the numbers in the published report. | ||
| Tables: CE3 Air Conditioning in U.S. Households | ||
| Tables: CE4 Water Heating in U.S. Households | ||
| Tables: CE5 Appliances, in U.S. Households | ||
| Fuel Tables | Consumption |
|---|---|
| Table 1. Natural Gas Consumption and Expenditures in U.S. Households by End Uses and Census Region | |
| Table 2. Fuel Oil Consumption and Expenditures in U.S. Households by End Uses and Census Region | |
| Table 3. Electricity Consumption and Expenditures in U.S. Households by End Uses and Census Region | |
| Table 4. LPG Consumption and Expenditures in U.S. Households by End Uses and Census Region | |
| Table 5. Kerosene Consumption and Expenditures in U.S. Households by End Uses and Census Region |
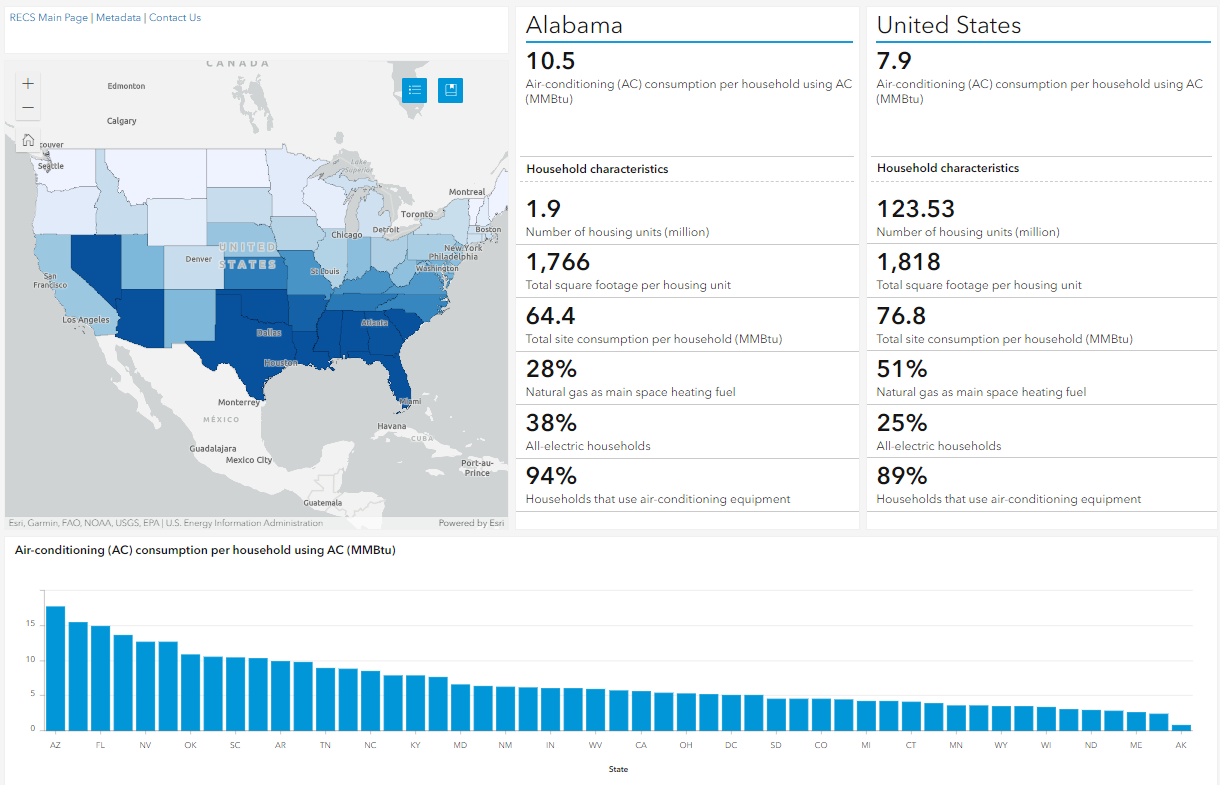
Household Energy Usage
The 1997 Residential Energy Consumption Survey (RECS) collected household energy data for the four most populated States: California, Florida, New York, and Texas. Data for all the other States are aggregated and available at the Census Division (groups of 3 to 8 States) level.
For an overview of the energy-related characteristics and usage in each of the four most populated States, click on the State (in the left column).
For detailed data, choose from the tables listed below. Each table presents the pertinent information for each of the four States. All these data are from the 1997 RECS and are the most recent end-user household data.
Energy End Usage: The suppliers of electricity, natural gas, fuel oil, and propane to the 5,000 households are then asked to provide the amount and cost of fuels delivered to the household. Through a statistical regression procedure, the total usage and costs of energy are allocated among four energy end uses: space heating, air conditioning, water heating, and appliances.
| Energy End-Use Tables for the Four Most Populated States (CA, FL, NY, and TX) |
Characteristics
(Million U.S. Households) |
Percentages
(Percent of U.S. Households) |
|---|---|---|
| Table CE1 - Total Energy Consumption in U.S. Households (Includes: number of households and fuels used, all households and per household consumption in both Btu and physical units.) |
||
| Table CE2 - Space-Heating Energy Consumption in U.S. Households (Includes: number of households and fuels used, all households and average per household Btu consumption, and heated square footage by fuel.) |
||
| Table CE3 - Electric Air-Conditioning (AC) Energy Consumption in U.S. Households (Includes: number of households using AC, all households and average per household AC consumption (in Btu and KWh), cooled square footage and cooling degree-days.) |
||
| Table CE4 - Water-Heating Energy Consumption in U.S. Households (Includes: number of households with water heating, fuels used, all households and average per household water-heating consumption.) |
||
| Table CE5 - Appliances Energy Consumption in U.S. Households (Includes: number of households with appliances; all households and average per household appliances consumption in Btu and physical units, and appliances fuel used.) |
Specific questions on this product may be directed to:
 View the dashboard ›