Electricity Monthly Update
Highlights: September 2023
-
Electricity demand 12-month highs were recorded in New York State (NYISO) on September 6 and in New England (ISONE) on September 7.
-
Wholesale electricity prices in Texas (ERCOT) reached $605/MWh on September 9 due to a heat wave that pushed high temperatures several degrees above previous all-time highs at many locations across the state.
-
Most areas of the country saw an increase in electricity generation from other renewable sources, with Texas (up 25.9%) and Florida (up 23.5%) seeing the largest percent increase in other renewables generation compared to September 2022.
Key indicators


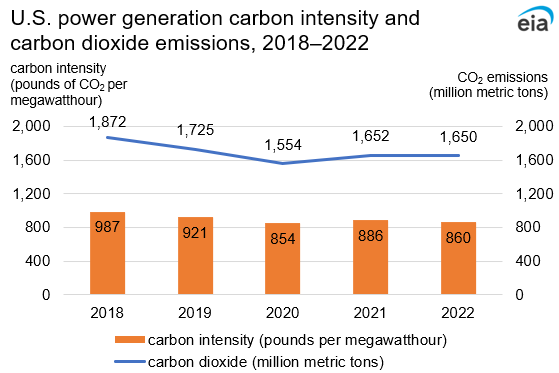
Carbon dioxide emissions fell slightly in 2022 due to a reduction in the carbon intensity of electric power sources
Data source: U.S. Energy Information Administration, Form EIA-923, Power Plant Operations Report
Note: Net generation is from Form EIA-923. Emissions include total emissions from both electricity generation and the production of useful thermal output. See Electric Power Annual, Appendix A, Technical Notes, for a description of the sources and methodology used to develop the emissions estimates.
U.S. CO2 emissions from power generation fell slightly in 2022 to 1,650 million metric tons from 1,652 million metric tons in 2021, a 0.1% reduction. This modest decrease came in the face of record high U.S. power generation in 2022 at 4,230 million megawatthours (MWh), a 2.9% increase compared with 2021 generation (4,110 million MWh). Offsetting this uptick in generation was a 3% reduction in the carbon intensity of power generation from 886 pounds (lb.) of CO2 per MWh in 2021 to 860 lb. CO2/MWh in 2022. The reduction in carbon intensity was driven by both the displacement of coal by natural gas and the increased market share of non-emitting renewable generation. Natural gas (970 lb. CO2/MWh in 2022) increased from 38.4% of total net generation in 2021 to 39.9% in 2022, while coal (2,257 lb. CO2/MWh in 2022) decreased from 21.9% of total net generation in 2021 to 19.7% in 2022. Meanwhile, non-emitting renewable generation (wind, hydroelectric, and solar generation) expanded from 18.1% of total net generation in 2021 to 19.7% in 2022.

Data source: U.S. Energy Information Administration, Form EIA-923, Power Plant Operations Report and predecessor forms.
Note: Net generation is from Form EIA-923. Emissions include total emissions from both electricity generation and the production of useful thermal output. Historical annual emissions and net generation data available at EIA’s Historical State Data page. See Electric Power Annual, Appendix A, Technical Notes, for a description of the sources and methodology used to develop the emissions estimates.
The fall in power generation CO2 emissions during the recent five years is part of a longer-term downward trend in emissions since power generation emissions peaked at 2,547 million metric tons in 2007. During the 1990 to 2007 period, power generation CO2 emissions increased from 1,954 million metric tons in 1990 to 2,547 million metric tons in 2007, an increase of 30%. The increase was mainly driven by a 37% increase in power generation demand in the face of flat carbon intensity. Carbon intensity only declined 4.7% during the 1990–2007 period. Between 2007 and 2022, power generation emission levels fell by 35%. This trend has been driven by a 37% decrease in carbon intensity in the presence of nearly flat power generation demand, which is up only 1.8% since 2007. The displacement of coal by natural gas and the increased use of non-emitting renewable generation sources have caused carbon intensity to decline since 2007. Natural gas’s share of generation increased from 21.6% of total generation in 2007 to 39.9% in 2022, while coal’s share fell from 48.5% to 19.7%. Non-emitting renewables, meanwhile, went from 6.8% of net generation in 2007 to 19.7% in 2022.

Data source: U.S. Energy Information Administration, Form EIA-923, Power Plant Operations Report
Note: Net generation is from Form EIA-923. Emissions include total emissions from both electricity generation and the production of useful thermal output. See Electric Power Annual, Appendix A, Technical Notes, for a description of the sources and methodology used to develop the emissions estimates.
These national trends, however, only tell part of the story because the carbon intensity of power generation varies significantly by state and census division. In 2022, the carbon intensity of power generation at the state level ranged from a low of 13 lb. CO2/MWh in Vermont to 1,960 lb. CO2/MWh in West Virginia. On a regional basis, the Pacific (365 lb. CO2/MWh), New England (588 lb. CO2/MWh), Middle Atlantic (638 lb. CO2/MWh), and South Atlantic (814 lb. CO2/MWh) census divisions all have emissions rates below the national average. These census divisions tend to have a high percentage of generation from renewable sources or a combination of high renewable and nuclear sources. Census divisions with emission rates above the national average are clustered in the center of the country: the West South Central (902 lb. CO2/MWh), East South Central (988 lb. CO2/MWh), Mountain (1,029 lb. CO2/MWh), East North Central (1,060 lb. CO2/MWh), and West North Central (1,073 lb. CO2/MWh) census divisions. In these census divisions, coal still plays an important role in power generation, although several states in these census divisions—such as South Dakota, Oklahoma, and Iowa—are below the national average emission rate due to the increased use of wind power.

Data source: U.S. Energy Information Administration, Form EIA-923, Power Plant Operations Report
Note: Net generation is from Form EIA-923. Emissions include total emissions from both electricity generation and the production of useful thermal output. See Electric Power Annual, Appendix A, Technical Notes, for a description of the sources and methodology used to develop the emissions estimates.
Despite the large statewide variance in carbon intensity levels, most states are reducing the carbon intensity of their power generation. Just as carbon intensity has been dropping at the national level, it is also dropping at the state level; 42 states and the District of Columbia reduced the carbon intensity of their power generation in 2022 relative to 2018. The states that reduced their carbon intensity the most between 2018 and 2022 were Iowa, Nebraska, New Mexico, and Wyoming. The District of Columbia also reduced it carbon intensity significantly over this time frame. A strong increase in wind generation helped to lower carbon intensities in Iowa, Nebraska, and New Mexico. In Wyoming, both the displacement of coal by natural gas and increased wind generation helped push emission rates lower. In the case of the District of Columbia, solar generation went from 0% of total generation in 2018 to 14% in 2022, helping to lower the carbon intensity.
-
Principal Contributor:
- Name: Paul McArdle
Email: [email protected]
End Use: September 2023
Retail rates/prices and consumption
In this section, we look at what electricity costs and how much is purchased. Charges for retail electric service are based primarily on rates approved by state regulators. However, a number of states have allowed retail marketers to compete to serve customers and these competitive retail suppliers offer electricity at a market-based price.
EIA does not directly collect retail electricity rates or prices. However, using data collected on retail sales revenues and volumes, we calculate average retail revenues per kWh as a proxy for retail rates and prices. Retail sales volumes are presented as a proxy for end-use electricity consumption.
Average revenue per kWh by state


Twenty-seven states and the District of Columbia saw increased revenue per kilowatt-hour (kWh) compared to last September, despite average revenue per kWh decreasing by 0.5% on a national basis. The largest percent increase was in Maine, up 16.4%, followed by Rhode Island, up 13.5%, and California, up 12.4%. Compared to last year, average revenue per kWh figures decreased in twenty-three states. The largest percent decrease was in Louisiana, down 23.5%, followed by New Hampshire, down 19.2%, and Hawaii, down 13.3%. In the contiguous US, California, Connecticut, and Rhode Island had the highest average revenues at 27.03, 23.87, and 22.51 cents per kWh, respectively. Georgia had the median average revenue at 11.58 cents per kWh. North Dakota, Wyoming, and Louisiana had the lowest average revenues at 8.16, 8.64, and 8.79 cents per kWh, respectively.
| Average Revenues/Sales (¢/kWh) | Retail Sales (thousand MWh) | |||||||||||||||||||||||||||||||||||||||||||||||||||||||||||||||||||||||||||||||||||||||||||||||||
|---|---|---|---|---|---|---|---|---|---|---|---|---|---|---|---|---|---|---|---|---|---|---|---|---|---|---|---|---|---|---|---|---|---|---|---|---|---|---|---|---|---|---|---|---|---|---|---|---|---|---|---|---|---|---|---|---|---|---|---|---|---|---|---|---|---|---|---|---|---|---|---|---|---|---|---|---|---|---|---|---|---|---|---|---|---|---|---|---|---|---|---|---|---|---|---|---|---|---|
| End-use sector | September 2023 | Change fromSeptember 2022 | September 2023 | Change fromSeptember 2022 | Year to Date | |||||||||||||||||||||||||||||||||||||||||||||||||||||||||||||||||||||||||||||||||||||||||||||
| Residential | 16.29 | 0.6% | 133,109 | 3.0% | 1,129,162 | |||||||||||||||||||||||||||||||||||||||||||||||||||||||||||||||||||||||||||||||||||||||||||||
| Commercial | 13.25 | -0.2% | 123,274 | -0.7% | 1,041,627 | |||||||||||||||||||||||||||||||||||||||||||||||||||||||||||||||||||||||||||||||||||||||||||||
| Industrial | 8.53 | -5.8% | 85,764 | -0.9% | 765,911 | |||||||||||||||||||||||||||||||||||||||||||||||||||||||||||||||||||||||||||||||||||||||||||||
| Transportation | 14.20 | 13.0% | 655 | 17.4% | 5,137 | |||||||||||||||||||||||||||||||||||||||||||||||||||||||||||||||||||||||||||||||||||||||||||||
| Total | 13.25 | -0.5% | 342,801 | 0.7% | 2,941,837 | |||||||||||||||||||||||||||||||||||||||||||||||||||||||||||||||||||||||||||||||||||||||||||||
| Source: U.S. Energy Information Administration | ||||||||||||||||||||||||||||||||||||||||||||||||||||||||||||||||||||||||||||||||||||||||||||||||||
Total average revenues per kilowatt-hour (kWh) decreased by 0.5% from last September, to 13.25 cents/kWh in September 2023. Two of the four sectors saw increases in average revenues per kWh. The Transportation sector rose the most from last September, up 13.0%, followed by the Residential sector, up 0.6%. Two of the four sectors saw decreases in average revenues per kWh. The Industrial sector dropped the most from last September, down 5.8%, followed by the Commercial sector, down 0.2%. Two of the four sectors saw increases in retail sales. The Transportation sector increased the most from last September, up 17.4%, followed by the Residential sector, up 3.0%. The Industrial sector decreased the most from last September, down 0.9%, followed by the Commercial sector, down 0.7%.
Retail sales


Twenty-three states saw a decrease in retail sales volume compared to last year. California had the highest percent year over year decrease, down 14.1%, followed by Nevada, down 10.0%, and Idaho, down 7.7%. Twenty-seven states and the District of Columbia saw an increase in retail sales volume in September 2023 compared to September 2022. North Dakota had the highest percent year over year increase in retail sales, up 12.9%, followed by Mississippi, up 12.4%, and Louisiana, up 11.9%.
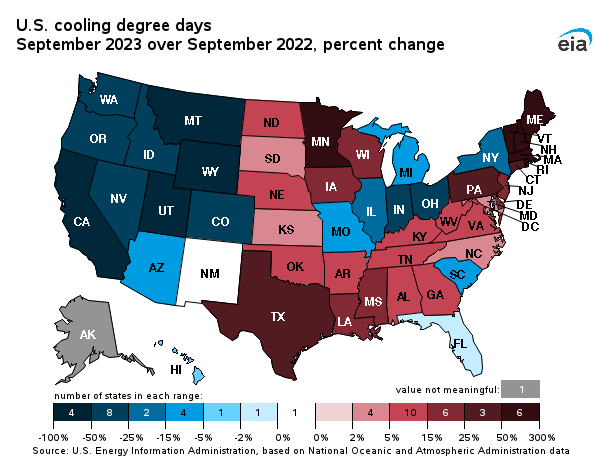

Nineteen states and the District of Columbia saw a decrease in Cooling Degree Days (CDDs) from last September. In the contiguous US, Wyoming had the highest percent year over year decrease, down 88%, followed by California, down 65%, and Montana, down 58%. Twenty-nine states saw an increase in CDDs compared to last September. In the contiguous US, Vermont had the highest percent year over year increase, up 1,100%, followed by New Hampshire, up 326%, and Massachusetts, up 260%. New Mexico had the same amount of CDD’’s as last September. A handful of states on the west coast and Midwest saw a cooler September and thus a decrease in CDDs compared to normal, while most of the rest of the states saw a warmer than normal September and thus an increase in CDDs.
Resource Use: September 2023
Supply and fuel consumption
In this section, we look at the resources used to produce electricity. Generating units are chosen to run primarily on their operating costs, of which fuel costs account for the lion's share. Therefore, we present below, electricity generation output by fuel type and generator type. Since the generator/fuel mix of utilities varies significantly by region, we also present generation output by region.
Generation output by region

Net electricity generation in the United States increased by 1.8% compared to September 2022. All areas of the country, except for the West, saw a year-over-year increase in electricity generation. The Western region was the outlier, seeing a 9.0% decrease in electricity generation, as this part of the country experienced a much cooler September this year compared to last. This led to a decreased need for residential cooling in the West and thus, a decrease in demand for electricity. Texas saw the largest increase in year-over-year electricity generation (up 10.8%), due to the record temperatures experienced during September 2023.
The change in electricity generation from coal was mixed throughout the country, with only the Southeast and Florida seeing an increase in coal generation compared to the previous year. All areas of the country, except for the West, saw an increase in natural gas generation. Most areas of the country saw an increase in electricity generation from other renewable sources, with Texas (up 25.9%) and Florida (up 23.5%) seeing the largest percent increase in other renewables generation compared to September 2022.
Fossil fuel consumption by region
The chart above compares coal consumption in September 2022 and September 2023 by region and the second tab compares natural gas consumption by region over the same period. Changes in coal and natural gas consumption were similar to their respective changes in coal and natural gas generation.
The third tab presents the change in the relative share of fossil fuel consumption by fuel type on a percentage basis, calculated using equivalent energy content (Btu). This highlights changes in the relative market shares of coal, natural gas, and petroleum. Most regions of the country saw their share of natural gas increase at the expense of coal.
The fourth tab presents the change in coal and natural gas consumption on an energy content basis by region. The changes in total coal and natural gas consumption were similar to the changes seen in total coal and natural gas net generation in each region.
Fossil fuel prices
To gain some insight into the changing pattern of consumption of fossil fuels over the past year, we look at relative monthly average spot fuel prices. A common way to compare fuel prices is on an equivalent $/MMBtu basis as shown in the chart above. For the fourth consecutive month, the average price of natural gas at Henry Hub increased from the previous month, going from $2.65/MMBtu in August 2023 to $2.74/MMBtu in September 2023. The natural gas price for New York City (Transco Zone 6 NY) saw an increase in price from the previous month, going from $1.31/MMBtu in August 2023 to $1.54/MMBtu in September 2023. The average spot price of Central Appalachian coal increased from the previous month, going from $2.88/MMBtu in August 2023 to $3.01/MMBtu in September 2023.
For the fourth consecutive month, the New York Harbor residual oil price saw an increase in price from the previous month, going from $13.67/MMBtu in August 2023 to $14.54/MMBtu in September 2023. Even with many parts of the country experiencing above average temperatures during September 2023, oil was still priced out of most electricity markets for baseload operations during the month.
A fuel price comparison based on equivalent energy content ($/MMBtu) does not reflect differences in energy conversion efficiency (heat rate) among different types of generators. Gas-fired combined-cycle units tend to be more efficient than coal-fired steam units. The second tab shows coal and natural gas prices on an equivalent energy content and efficiency basis. The Henry Hub natural gas price ($21.95/MWh) saw an increase from the previous month ($21.25/MWh) but was still below the Central Appalachian coal price ($32.54/MWh) in September 2023. The price of natural gas at New York City ($12.36/MWh) decreased from the previous month ($10.50/MWh) and was below the price of Central Appalachian coal ($32.54/MWh) during September 2023.
The conversion shown in this chart is done for illustrative purposes only. The competition between coal and natural gas to produce electricity is more complex. It involves delivered prices and emission costs, the terms of fuel supply contracts, and the workings of fuel markets.
Regional Wholesale Markets: September 2023
The United States has many regional wholesale electricity markets. Below we look at monthly and annual ranges of on-peak, daily wholesale prices at selected pricing locations and daily peak demand for selected electricity systems in the Nation. The range of daily prices and demand data is shown for the report month and for the year ending with the report month.
Prices and demand are shown for six Regional Transmission Operator (RTO) markets: ISO New England (ISO-NE), New York ISO (NYISO), PJM Interconnection (PJM), Midwest ISO (MISO), Electric Reliability Council of Texas (ERCOT), and two locations in the California ISO (CAISO). Also shown are wholesale prices at trading hubs in Louisiana (into Entergy), Southwest (Palo Verde) and Northwest (Mid-Columbia). In addition to the RTO systems, peak demand is also shown for the Southern Company, Progress Florida, and the Bonneville Power Authority (BPA). Refer to the map tabs for the locations of the electricity and natural gas pricing hubs and the electric systems for which peak demand ranges are shown.
In the second tab immediately below, we show monthly and annual ranges of on-peak, daily wholesale natural gas prices at selected pricing locations in the United States. The range of daily natural gas prices is shown for the same month and year as the electricity price range chart. Wholesale electricity prices are closely tied to wholesale natural gas prices in all but the center of the country. Therefore, one can often explain current wholesale electricity prices by looking at what is happening with natural gas prices.
Wholesale prices

Outside of Texas (ERCOT), wholesale electricity prices were on the bottom end of the 12-month range during the month of September. New York City (NYISO) set a new 12-month low price of $24/MWh on September 1. Monthly low prices in New England (ISONE) and the Mid-Atlantic (PJM) were within $3/MWh of 12-month lows during the month. In Texas, prices in ERCOT reached $605/MWh on September 9 as a heat wave enveloped the state and pushed high temperatures several degrees above previous all-time highs at many locations across the state. Wholesale natural gas prices were at the bottom of the 12-month range at all selected trading hubs during the month. Tetco M-3 in the Mid-Atlantic set a new 12-month low price of $0.77/MMBtu on September 25. A $0.78/MMBtu price in New York City (Transco Z6 NY) on September 25 was within one penny of a 12-month low at that location. Monthly high prices east of the Rocky Mountains remained below $2.81/MMBtu at all selected trading hubs while monthly high prices on the West Coast ranged between $2.92/MMBtu in the Northwest (Sumas) and $4.43/MMBtu in Northern California (PG&E Citygate).
Electricity system daily peak demand

September exhibited a high degree of shoulder season characteristics (“shoulder season” refers to the spring and fall months between the peak summer and winter seasons), with hot weather early giving way to much cooler weather later in the month. As such, there was an extremely broad range of electricity demand on balancing systems across the country. In New York State, NYISO set a new 12-month high of 30,206 MW on September 6 while reaching a high of 16,209 MW just 17 days later on September 23. In New England, a new 12-month high of 23,475 MW was recorded on September 7 in ISONE while a system demand high of only 12,793 MW was recorded on September 30. So both electricity systems in the Northeast nearly set new 12-month high and low readings during the same month. A broad range of demand was also seen in the Midwest (MISO), Southern Company, and Progress Florida. In the Northwest, a new 12-month low demand of 5,776 MW was set on September 23 on the Bonneville Power Administration system.
Electric Power Sector Coal Stocks: September 2023
Total U.S. coal stockpiles had a month-over-month decrease of 1.0%, reaching 117 million tons in September 2023. This decrease in total U.S. coal stockpiles follows the normal seasonal pattern whereby coal power plants use up their stockpiles during the peak summer months when demand for electricity generation is higher.
Days of burn
The average number of days of burn held at electric power plants is a forward-looking estimate of coal supply given a power plant's current stockpile and past consumption patterns. For bituminous units largely located in the eastern United States, the average number of days of burn decreased from the previous month, going from 147 days of forward-looking days of burn in August 2023 to 143 days of burn in September 2023. For subbituminous units largely located in the western United States, the average number of days of burn increased, going from 148 days of burn in August 2023 to 152 days of burn in September 2023.
Coal stocks and average number of days of burn for non-lignite coal by region (electric power sector)
| September 2023 | September 2022 | August 2023 | ||||||||||||||||||||||||||||||||||||||||||||||||||||||||||||||||||||||||||||||||||||||||||||||||
|---|---|---|---|---|---|---|---|---|---|---|---|---|---|---|---|---|---|---|---|---|---|---|---|---|---|---|---|---|---|---|---|---|---|---|---|---|---|---|---|---|---|---|---|---|---|---|---|---|---|---|---|---|---|---|---|---|---|---|---|---|---|---|---|---|---|---|---|---|---|---|---|---|---|---|---|---|---|---|---|---|---|---|---|---|---|---|---|---|---|---|---|---|---|---|---|---|---|---|
| Zone | Coal | Stocks (1000 tons) | Days of Burn | Stocks (1000 tons) | Days of Burn | % Change of Stocks | Stocks (1000 tons) | Days of Burn | % Change of Stocks | |||||||||||||||||||||||||||||||||||||||||||||||||||||||||||||||||||||||||||||||||||||||||
| Northeast | Bituminous | 2,163 | 279 | 1,925 | 365 | 12.4% | 2,260 | 316 | -4.3% | |||||||||||||||||||||||||||||||||||||||||||||||||||||||||||||||||||||||||||||||||||||||||
| Subbituminous | . | . | . | . | . | . | . | . | ||||||||||||||||||||||||||||||||||||||||||||||||||||||||||||||||||||||||||||||||||||||||||
| South | Bituminous | 17,603 | 136 | 12,476 | 108 | 41.1% | 18,921 | 145 | -7.0% | |||||||||||||||||||||||||||||||||||||||||||||||||||||||||||||||||||||||||||||||||||||||||
| Subbituminous | 5,594 | 105 | 3,584 | 63 | 56.1% | 5,474 | 99 | 2.2% | ||||||||||||||||||||||||||||||||||||||||||||||||||||||||||||||||||||||||||||||||||||||||||
| Midwest | Bituminous | 12,737 | 146 | 7,247 | 87 | 75.8% | 12,761 | 137 | -0.2% | |||||||||||||||||||||||||||||||||||||||||||||||||||||||||||||||||||||||||||||||||||||||||
| Subbituminous | 29,159 | 156 | 17,096 | 111 | 70.6% | 29,140 | 155 | 0.1% | ||||||||||||||||||||||||||||||||||||||||||||||||||||||||||||||||||||||||||||||||||||||||||
| West | Bituminous | 2,647 | 150 | 3,029 | 163 | -12.6% | 2,807 | 148 | -5.7% | |||||||||||||||||||||||||||||||||||||||||||||||||||||||||||||||||||||||||||||||||||||||||
| Subbituminous | 29,320 | 166 | 15,536 | 93 | 88.7% | 28,359 | 155 | 3.4% | ||||||||||||||||||||||||||||||||||||||||||||||||||||||||||||||||||||||||||||||||||||||||||
| U.S. Total | Bituminous | 35,150 | 143 | 24,678 | 110 | 42.4% | 36,749 | 147 | -4.4% | |||||||||||||||||||||||||||||||||||||||||||||||||||||||||||||||||||||||||||||||||||||||||
| Subbituminous | 64,073 | 152 | 36,216 | 97 | 76.9% | 62,973 | 148 | 1.7% | ||||||||||||||||||||||||||||||||||||||||||||||||||||||||||||||||||||||||||||||||||||||||||
|
Source: U.S. Energy Information Administration NOTE: Stockpile levels shown above reflect a sample of electric power sector plants, which were used to create the days of burn statistics. These levels will not equal total electric power sector stockpile levels. |
||||||||||||||||||||||||||||||||||||||||||||||||||||||||||||||||||||||||||||||||||||||||||||||||||
Methodology and Documentation
General
The Electricity Monthly Update is prepared by the Electric Power Operations Team, Office of Electricity, Renewables and Uranium Statistics, U.S. Energy Information Administration (EIA), U.S. Department of Energy. Data published in the Electricity Monthly Update are compiled from the following sources: U.S. Energy Information Administration, Form EIA-826,"Monthly Electric Utility Sales and Revenues with State Distributions Report," U.S. Energy Information Administration, Form EIA-923, "Power Plant Operations Report," fuel spot prices from Bloomberg Energy, electric power prices from SNL Energy, electric system demand data from Ventyx Energy Velocity Suite, and weather data and imagery from the National Oceanic and Atmospheric Administration.
The survey data are collected monthly using multiple-attribute cutoff sampling of power plants and electric retailers for the purpose of estimation for various data elements (generation, stocks, revenue, etc.) for various categories, such as geographic regions. (The data elements and categories are "attributes.") The nominal sample sizes are: for the Form EIA-826, approximately 450 electric utilities and other energy service providers; for the Form EIA-923, approximately 1900 plants. Regression-based (i.e., "prediction") methodologies are used to estimate totals from the sample. Essentially complete samples are collected for the Electric Power Monthly (EPM), which includes State-level values. The Electricity Monthly Update is based on an incomplete sample and includes only regional estimates and ranges for state values where applicable. Using "prediction," it is generally possible to make estimates based on the incomplete EPM sample, and still estimate variances.
For complete documentation on EIA monthly electric data collection and estimation, see the Technical Notes PDF to the Electric Power Monthly. Values displayed in the Electric Monthly Update may differ from values published in the Electric Power Monthly due to the additional data collection and data revisions that may occur between the releases of these two publications.
Accessing the data: The data included in most graphics can be downloaded via the "Download the data" icon above the navigation pane.Some missing data are proprietary and non-public.
For a guide that describes electricity data that EIA collects and how the data are made available to the public, see the Guide to EIA Electric Power Data.
Key Indicators
The Key Indicators in the table located in the "Highlights" section, are defined below. The current month column includes data for the current month at a national level. The units vary by statistic, but are included in the table. The "% Change from 2010" value is the current month divided by the corresponding month last year (e.g. July 2011 divided by July 2010). This is true for Total Generation, Residential Retail Price, Retail Sales, Degree-Days, Coal Stocks, Coal and Natural Gas Consumption. The Henry Hub current month value is the average weekday price for the current month. The Henry Hub "% Change from 2010" value is the average weekday price of the same month from 2010 divided by the average weekday price of the current month.
- Total Net Generation: Reflects the total electric net generation for all reporting sectors as collected via the Form EIA-923.
- Residential Retail Price: Reflects the average retail price as collected via the Form EIA-826.
- Retail Sales: Reflects the reported volume of electricity delivered as collected via the Form EIA-826.
- Degree-Days: Reflects the total population-weighted United States degree-days as reported by the National Oceanic and Atmospheric Administration.
- Natural Gas Henry Hub: Reflects the average price of natural gas at Henry Hub for the month. The data are provided by Bloomberg.
- Coal Stocks: Reflects the total coal stocks for the Electric Power Sector as collected via the Form EIA-923.
- Coal Consumption: Reflects the total coal consumption as collected via the Form EIA-923.
- Natural Gas Consumption: Reflects the total natural gas consumption as collected via the Form EIA-923.
- Nuclear Outages: Reflects the average daily outage amount for the month as reported by the Nuclear Regulatory Commission's Power Reactor Status Report and the latest net summer capacity data collected on the EIA-860 Annual Generator Report.
Sector Definitions
The Electric Power Sector comprises electricity-only and combined heat and power (CHP) plants within the North American Industrial Classification System 22 category whose primary business is to sell electricity, or electricity and heat, to the public (i.e., electric utility plants and Independent Power Producers (IPPs), including IPP plants that operate as CHPs). The All Sectors totals include the Electric Power Sector and the Commercial and Industrial Sectors (Commercial and Industrial power producers are primarily CHP plants).
Degree Days
Degree-days are relative measurements of outdoor air temperature used as an index for heating and cooling energy requirements. Heating degree-days are the number of degrees that the daily average temperature falls below 65° F. Cooling degree-days are the number of degrees that the daily average temperature rises above 65° F. The daily average temperature is the mean of the maximum and minimum temperatures in a 24-hour period. For example, a weather station recording an average daily temperature of 40° F would report 25 heating degree-days for that day (and 0 cooling degree-days). If a weather station recorded an average daily temperature of 78° F, cooling degree-days for that station would be 13 (and 0 heating degree days).
Per Capita Retail Sales
The per capita retail sales statistics use 2011 population estimates from the U.S. Census Bureau and monthly data collected by the Energy Information Administration. The volume of electricity delivered to end users for all sectors in kilowatthours is divided by the 2011 population estimate for each state.
Composition of Fuel Categories
Net generation statistics are grouped according to regions (see Electricity Monthly Update Explained Section) by generator type and fuel type. Generator type categories include:
- Fossil Steam: Steam turbines powered by the combustion of fossil fuels
- Combined Cycle: Combined cycle generation powered by natural gas, petroluem, landfill gas, or other miscellaneous energy sources
- Other Fossil: Simple cycle gas turbines, internal combustion turbines, and other fossil-powered technology
- Nuclear Steam: Steam turbines at operating nuclear power plants
- Hydroelectric: Conventional hydroelectric turbines
- Wind: Wind turbines
- Other renewables: All other generation from renewable sources such as geothermal, solar, or biomass
- Other: Any other generation technology, including hydroelectric pumped storage
Generation statistics are also displayed by fuel type. These include:
- Coal: all generation associated with the consumption of coal
- Natural Gas: all generation associated with the consumption of natural gas
- Nuclear: all generation associated with nuclear power plants
- Hydroelectric: all generation associated with conventional hydroelectric turbines
- Other Renewable: all generation associated with wind, solar, biomass, and geothermal energy sources
- Other Fossil: all generation associated with petroleum products and fossil-dervied fuels
- Other: all other energy sources including waste heat, hydroelectric pumped storage, other reported sources
Relative Fossil Fuel Prices
Relative fossil fuel prices are daily averages of fossil fuel prices by month, displayed in dollars per million British thermal units as well as adjusted for operating efficiency at electric power plants to convert to dollars per megawatthour. Average national heat rates for typical operating units for 2010 were used to convert relative fossil fuel prices.
Average Days of Burn
Average Days of Burn is defined as the average number of days remaining until coal stocks reach zero if no further deliveries of coal are made. These data have been calculated using only the population of coal plants present in the monthly Form EIA-923. This includes 1) coal plants that have generators with a primary fuel of bituminous coal (including anthracite) or subbituminous, and 2) are in the Electric Power Sector (as defined in the above "Sector definitions"). Excluded are plants with a primary fuel of lignite or waste coal, mine mouth plants, and out-of-service plants. Coal storage terminals and the related plants that they serve are aggregated into one entity for the calculation of Average Days of Burn, as are plants that share stockpiles.
Average Days of Burn is computed as follows: End of month stocks for the current (data) month, divided by the average burn per day. Average Burn per Day is the average of the three previous years' consumption as reported on the Form EIA-923.
These data are displayed by coal rank and by zone. Each zone has been formed by combining the following Census Divisions:
- Northeast — New England, Middle Atlantic
- South — South Atlantic, East South Central
- Midwest — West North Central, East North Central
- West — Mountain, West South Central, Pacific Contiguous
Coal Stocks vs. Days of Burn Stocks
The coal stocks data presented at the top of the Fossil Fuel Stocks section (“Coal Stocks”) will differ from the coal stocks presented in the Days of Burn section (“DOB Stocks”) at the bottom of the Fossil Fuel Stocks section. This occurs because Coal Stocks include the entire population of coal plants that report on both the annual and monthly Form EIA-923. The DOB Stocks only include coal plants that report on the monthly Form EIA-923 and have a primary fuel of bituminous (including anthracite) or subbituminous as reported on the Form EIA-860.