Current Issues & Trends
Recent Data
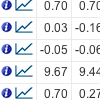
| Natural Gas | Electricity | Spark Spread |
||||||||||||||||||||||||||||||||||||||||||||||||||||||||||||||||||||||||||||||||||||||||||||||||
|---|---|---|---|---|---|---|---|---|---|---|---|---|---|---|---|---|---|---|---|---|---|---|---|---|---|---|---|---|---|---|---|---|---|---|---|---|---|---|---|---|---|---|---|---|---|---|---|---|---|---|---|---|---|---|---|---|---|---|---|---|---|---|---|---|---|---|---|---|---|---|---|---|---|---|---|---|---|---|---|---|---|---|---|---|---|---|---|---|---|---|---|---|---|---|---|---|---|---|
| Region | $/million Btu | % chg* | $/MWh | % chg* | $/MWh | |||||||||||||||||||||||||||||||||||||||||||||||||||||||||||||||||||||||||||||||||||||||||||||
| New England | 2.12 | +18.9 | 122.45 | +162.8 | 107.63 | |||||||||||||||||||||||||||||||||||||||||||||||||||||||||||||||||||||||||||||||||||||||||||||
| Mid-Atlantic | 1.89 | +15.1 | 141.57 | +186.9 | 128.33 | |||||||||||||||||||||||||||||||||||||||||||||||||||||||||||||||||||||||||||||||||||||||||||||
| Midwest | 2.07 | +13.5 | 86.81 | +91.5 | 72.30 | |||||||||||||||||||||||||||||||||||||||||||||||||||||||||||||||||||||||||||||||||||||||||||||
| Southwest | 1.72 | -4.6 | 42.25 | -47.2 | 30.25 | |||||||||||||||||||||||||||||||||||||||||||||||||||||||||||||||||||||||||||||||||||||||||||||
| Northwest | 0.97 | -41.4 | 30.00 | -64.3 | 23.19 | |||||||||||||||||||||||||||||||||||||||||||||||||||||||||||||||||||||||||||||||||||||||||||||
| *Percent changes based on daily settlement price from previous business day. Data source: Daily Prices |
||||||||||||||||||||||||||||||||||||||||||||||||||||||||||||||||||||||||||||||||||||||||||||||||||
Analysis & Projections
- Report Type: Data
Weekly Natural Gas Storage Report
Released July 11, 2024 | tags: - Report Type: Data
Underground Natural Gas Working Storage Capacity
Released April 30, 2024 | tags: - Report Type: Data
U.S. Crude Oil and Natural Gas Proved Reserves
Released April 29, 2024 | tags: - Report Types: Analysis, Forecast
Effects of Liquefied Natural Gas Exports on the U.S. Natural Gas Market
Released May 23, 2023 | tags: - Report Type: Analysis
Energy trade value between Mexico and the United States fell in 2023 on lower fuel prices
Released July 15, 2024 | tags: - Report Type: Data
Weekly Natural Gas Storage Report
Released July 11, 2024 | tags: - Report Types: Data, Analysis
Wholesale Electricity and Natural Gas Market Data
Released July 11, 2024 | tags: - Report Types: Analysis, Forecast
Short-Term Energy Outlook
Released July 09, 2024 | tags: - Report Type: Analysis
How has energy use changed throughout U.S. history?
Released July 03, 2024 | tags: - See more analysis & projections