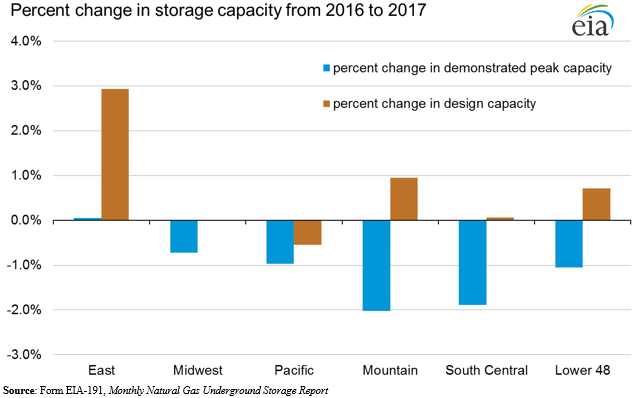
Natural gas design capacity is up slightly, driven by expansions in the East; but demonstrated maximum capacity is down in most regions
Working natural gas is defined as the amount of natural gas stored underground that can be withdrawn for use. Working natural gas storage capacity can be measured in two ways: design capacity and demonstrated maximum working gas capacity.
Design capacity: Design capacity is based on physical characteristics of the reservoir, installed equipment, and operating procedures particular to the site, often certified by federal or state regulators. It is calculated as the sum of reported working gas capacities of the 383 active storage fields as reported on survey Form EIA-191, Monthly Underground Natural Gas Storage Report, as of November 2017. This metric is a theoretical limit on the total amount of natural gas that can be stored underground and withdrawn for use.
Demonstrated maximum working gas capacity: The total demonstrated maximum working gas capacity, or demonstrated peak capacity, represents the sum of peak working natural gas volumes reported by each of the 383 active natural gas storage facilities in the Lower 48 states, regardless of when the individual peaks occurred over the most recent five-year period. In this report, the most recent demonstrated peak covers December 2012 through November 2017. Demonstrated peak capacity is based on survey data from the Form EIA-191 and is typically lower than design capacity because it relates to actual facility use for supply and demand reasons, rather than to potential use based on the design of the facility.
Natural gas design capacity is up slightly, driven by expansions in the East Design capacity of underground natural gas storage facilities was nearly the same in most storage regions in November 2017 compared with November 2016, with the exception of the East, where it increased by 2.9%, or 30 billion cubic feet (Bcf) as a result of several significant expansions to existing facilities. Design capacity in each of the other regions changed by 1% or less. Nationally, design capacity rose by 0.7%, or 34 Bcf, between November 2016 and November 2017, increasing to 4,725 Bcf.
Market conditions this period were similar to those in the last period:
- In 2017, for the fourth consecutive year, no new underground storage facilities began operation. Ten facilities expanded by 1 Bcf or more in 2017.
- Overall higher levels of natural gas production relative to a few years ago make supplies of natural gas more readily available to consumers. Production growth was mainly in shale gas production, particularly in the Northeast near several large population centers, reducing reliance on natural gas transported from the Gulf Coast.
- Infrastructure buildout (such as pipelines, compressor stations, and processing plants) has allowed natural gas to more easily reach end users, reduced regional spot price differentials, and fostered growth in production.
- Since 2015, winter natural gas prices have trended flatter than in previous years, reducing the incentive for storage, and natural gas spot prices were up relative to last year.
- The trend toward more natural gas-fired electricity generation continues, as natural gas-fired generation capacity has replaced some coal and nuclear generation capacity in recent years. However, natural gas-fired generation was down 7% in 2017 compared with 2016 because of mild summer weather, elevated natural gas prices, and higher levels of generation from renewables.
Design capacity in the East grew as a result of several significant capacity expansions, but no new fields were developed. Columbia Gas Transmission’s Weaver/Clinton field in Ohio expanded by 12 Bcf in June 2017, accounting for a large share of the regional capacity increase. In total, seven facilities in the East each expanded by 1 Bcf or more. Net capacity in the region grew despite two small facilities becoming inactive in the region in 2017.
Demonstrated peak capacity down in nearly every region. Demonstrated peak storage capacity, in contrast to design capacity, was down in nearly every region and down by 1.0% for the Lower 48 states, as of November 2017 compared with November 2016. Demonstrated peak capacity fell by 1% or 2% in most regions, with the exception of the East, which was essentially flat.
The demonstrated peak in the Lower 48 states fell between November 2016 and November 2017 by 1.0%, or by 46 Bcf, to 4,317 Bcf. This decrease was driven largely by the South Central region, which fell by 28 Bcf, but declines occurred in all regions except the East.
The South Central Nonsalt sub-region accounted for most of the decrease in the South Central region and in the Lower 48 states. The South Central Nonsalt sub-region’s demonstrated peak fell by 25 Bcf, or 2%. Because no facilities in the region became inactive, the decrease in demonstrated peak capacity was entirely the result of previous five-year peaks occurring before December 2012.
The general decline in the demonstrated peak occurred amid the following market conditions:
- The 2017 injection season began in April at fairly high storage levels of working gas but ended in October at near the five-year average. As a result of ending the injection season at near-average levels, few facilities reached new demonstrated peaks in 2017.
- Total U.S. production of natural gas was essentially flat in 2017 compared with 2016, although it increased toward the end of 2017.
- Production in the Northeast continued to grow as a result of pipeline buildout and higher natural gas prices in 2017 relative to 2016.
- The 2017 injection season also saw moderate power demand during milder summer weather and higher natural gas prices for the power sector compared with 2016. Overall U.S. consumption of natural gas has been relatively flat since 2015.
- Exports of domestically-sourced liquefied natural gas (LNG) out of Sabine Pass in Louisiana, as well as increased pipeline exports to Mexico, have supported prices.
Average-to-high storage volumes: As a result of ending the injection season at near-average levels, few facilities reached new demonstrated peaks in 2017. For most of 2017, working gas stocks were well above the five-year average, but by the end of October 2017, working gas levels were 3,778 Bcf, 1.5% lower than the previous five-year average of 3,837 Bcf (covering October 2012 through October 2016). High stocks have the potential to increase the demonstrated peak because storage facilities are better positioned to fill to near their design capacity.
No new underground storage facilities: No new storage facilities began operating in 2017, for the fourth consecutive year. Increases in working gas design capacity for the period came almost entirely from expansions to existing facilities, predominantly in the East.
Most planned storage projects are concentrated in salt formations, likely because of their high deliverability and cycling rates. Salt storage facilities are capable of withdrawing natural gas quickly, sometimes within an hour, and they are also able to pivot more readily between injections and withdrawals. Both capabilities make them more responsive to customer demand than most other types of underground storage. Few new storage facilities are currently planned for the next several years.
Few newly inactive or newly active fields: One new storage field, Lewis Creek, began operation at the East Cheyenne facility in Colorado. Two small storage fields became inactive during this period: the NGO Development Corporation’s Love Storage/Rosefield and the Eric Storage/Clinton field, both located in Ohio. Together, these fields removed slightly less than 0.5 Bcf of design capacity from the East region. A field is considered inactive after a full year without any injection activity, or when the company declares that a storage field is drawing down its stocks for abandonment. No previously inactive fields became active between November 2016 and November 2017.
Increasing production, both nationally and in Appalachia: With natural gas prices rising in 2017 relative to 2016, production increased, particularly toward the end of the year. Production, measured as gross withdrawals of natural gas from oil and gas wells, set an all-time record high in November 2017 and has continued increasing since then. Growth in production coincides with an expanding export market and pipeline capacity.
Exports of LNG and pipeline natural gas both grew in 2017. Much of the new pipeline exports have gone to Mexico, which has built new pipelines to supply natural gas to fuel power generation. Exports increase total demand for domestic natural gas, providing support for higher prices.
Infrastructure buildout, concentrated in the Northeast, has allowed more production to come online. New infrastructure has also reduced the price spread between regional Northeastern prices and the national benchmark natural gas price at Henry Hub in Louisiana. In recent years, increased production in the Appalachian Basin in the Northeast has driven up U.S. production totals. Data in EIA’s Drilling Productivity Report show natural gas production in the region growing almost continually since 2009.
Higher prices in 2017, but relatively flat wintertime prices: The natural gas Henry Hub spot price averaged $2.96 per million British thermal units (MMBtu) in 2017, up 44 cents/MMBtu relative to the 2016 average. In the electric sector, natural gas prices averaged $3.40/MMBtu, up 51 cents relative to 2016. The price relates to short-term supply, because it reduces some amount of electric-power sector demand and supports production, allowing more natural gas to flow into storage. Higher levels of natural gas in storage have the potential to increase the demonstrated peak.
Another relationship between natural gas prices and storage is the price paid for natural gas during the wintertime. Storage facilities, particularly nonsalt facilities that typically cycle gas only once a year, can store natural gas during the spring, summer, or fall, when prices are relatively low, and then withdraw the natural gas during the winter, when prices tend to be higher. In recent years, however, the wintertime prices have not been consistently higher than during the rest of the year. This change in seasonal prices reduces the financial incentive to invest in storage, and it may be one reason why design capacity only grew modestly in 2017.
Moderating electric sector demand, but a continuing trend towards natural gas: Natural gas accounted for slightly less than 32% of total electricity generation in 2017, down from nearly 34% in 2016. This drop in share was partly because of somewhat higher natural gas prices in 2017 and partly because of mild summer weather for the nation. Generation from renewable sources grew in 2017, which reduced the share of natural gas and coal-fired generation. Nevertheless, natural gas-fired capacity grew in 2017 and is expected to continue growing in 2018.
| Estimates of Underground Natural Gas Storage Demonstrated and Design Capacity, as of November 2017
(billion cubic feet, unless otherwise noted) | ||||||||
|---|---|---|---|---|---|---|---|---|
| Demonstrated Maximum Working Gas Volume1 | Working Gas Design Capacity2 | Demonstrated Maximum Working Gas Share of Working Gas Design Capacity3 | ||||||
| Region | (Dec 2011 - Nov 2016) | (Dec 2012 - Nov 2017) | Percent Change |
Nov 2016 | Nov 2017 | Percent Change |
Nov 2016 | Nov 2017 |
| East | 989 | 990 | 0.1% | 1,031R | 1,061 | 2.9% | 96% | 93% |
| Midwest | 1,194 | 1,186 | -0.7% | 1,226 | 1,226 | 0.0% | 97% | 97% |
| Mountain | 275R | 270 | -2.0% | 462 | 466 | 1.0% | 60% | 58% |
| Pacific4 | 415 | 411 | -1.0% | 416 | 414 | -0.5% | 100% | 99% |
| South Central | 1,488R | 1,460 | -1.9% | 1,557R | 1,558 | 0.1% | 96% | 94% |
| Nonsalt | 1,050 | 1,025 | -2.3% | 1,065 | 1,065 | -0.1% | 99% | 96% |
| Salt | 439R | 435 | -0.8% | 492 | 493 | 0.3% | 89% | 88% |
| Lower 48 | 4,363R | 4,317 | -1.0% | 4,691R | 4,725 | 0.7% | 93% | 91% |
|
Source: Form EIA-191, Monthly Natural Gas Underground Storage Report Note: Design capacity information for all facilities, including inactive fields, is available in the Natural Gas Annual Respondent Query System. Totals and calculations may not equal the sum of the components because of independent rounding. Information about storage regions is available at Storage Basics. Mentions of specific companies in this report include only information that is publicly available on EIA’s website or on the Federal Energy Regulatory Commission (FERC) dockets. R indicates that figures have been revised since the previous year’s Peak Capacity Report. (1) Demonstrated maximum working gas volume, or demonstrated peak, is the sum of the highest storage inventory levels of working gas observed in each distinct storage reservoir over the previous five-year period as reported by the operator on the Form EIA-191, Monthly Underground Gas Storage Report. The timing of the peaks for different facilities need not coincide. Inactive fields were removed from aggregate statistics. (2) Working gas design capacity is an estimate of a natural gas facility's physical working gas capacity as reported by the operator on the Form EIA-191 Monthly Underground Natural Gas Storage Report. It represents the sum of all fields' capacities at a point in time. It is a measure based on the physical characteristics of the reservoir, installed equipment, and operating procedures particular to the site that is often certified by federal or state regulators. Inactive fields were removed from aggregate statistics. (3) Demonstrated maximum working gas volume in some cases exceeds 100% of design capacity. This is because design capacity limits may differ from actual capacity limits in storage fields, as determined by the facility operator and local regulations. (4) The design capacity and demonstrated peak capacity of Southern California Gas Company’s Aliso Canyon field were included in this report and in the Pacific region totals. Although this field was largely unavailable during 2017 for storage service, it technically met EIA’s criteria as an active storage facility. |
||||||||
| Estimates of Underground Natural Gas Storage Demonstrated and Design Capacity, as of November 2017
(billion cubic feet, unless otherwise noted) | |||||||||
|---|---|---|---|---|---|---|---|---|---|
| Demonstrated Maximum Working Gas Volume1 | Working Gas Design Capacity2 | Demonstrated Maximum Working Gas Share of Working Gas Design Capacity3 | |||||||
| Region | State | (Dec 2011 - Nov 2016) | (Dec 2012 - Nov 2017) | Change | Nov 2016 | Nov 2017 | Change | Nov 2016 | Nov 2017 |
| East | PA | 405 | 403 | -2 | 417 | 418 | 1 | 97% | 96% |
| WV | 231 | 233 | 2 | 232R | 240 | 8 | 99% | 97% | |
| MD | 17 | 17 | 0 | 18 | 18 | 0 | 95% | 95% | |
| VA | 6 | 5 | 0 | 5 | 5 | 0 | 103% | 98% | |
| OH | 209 | 209 | 1 | 231 | 252 | 21 | 91% | 83% | |
| NY | 121 | 121 | 0 | 127 | 127 | 1 | 96% | 95% | |
| Total | 989 | 990 | 1 | 1,031R | 1,061 | 30 | 96% | 93% | |
| Midwest | IL | 281 | 279 | -3 | 301 | 301 | 0 | 93% | 92% |
| IA | 82 | 82 | 0 | 90 | 90 | 0 | 91% | 91% | |
| MN | 2 | 2 | 0 | 2 | 2 | 0 | 107% | 107% | |
| TN | 1 | 1 | 0 | 2 | 2 | 0 | 72% | 74% | |
| IN | 31 | 31 | 0 | 31 | 31 | 0 | 98% | 98% | |
| MO | 7 | 7 | 0 | 6 | 6 | 0 | 114% | 115% | |
| KY | 108 | 108 | 0 | 107 | 108 | 0 | 101% | 100% | |
| MI | 682 | 676 | -6 | 686 | 686 | 0 | 99% | 99% | |
| Total | 1,194 | 1,186 | -9 | 1,226 | 1,226 | 0 | 97% | 97% | |
| Mountain | MT | 54 | 49 | -5 | 197 | 197 | 0 | 27% | 25% |
| NE | 14 | 14 | -1 | 13 | 13 | 0 | 114% | 109% | |
| UT | 53 | 53 | 0 | 55 | 55 | 0 | 96% | 96% | |
| NM | 49 | 49 | 0 | 60 | 60 | 0 | 82% | 83% | |
| CO | 60R | 60 | 0 | 64 | 68 | 4 | 94% | 88% | |
| WY | 45 | 45 | 0 | 73 | 73 | 0 | 62% | 62% | |
| Total | 275R | 270 | -6 | 462 | 466 | 4 | 60% | 58% | |
| Pacific | WA | 24 | 24 | 0 | 25 | 25 | 0 | 96% | 96% |
| OR | 19 | 19 | 0 | 16 | 16 | 0 | 118% | 118% | |
| CA4 | 373 | 369 | -4 | 375 | 373 | -2 | 99% | 99% | |
| Total4 | 415 | 411 | -4 | 416 | 414 | -2 | 100% | 99% | |
| South Central | MS | 178R | 174 | -3 | 205 | 205 | 0 | 87% | 85% |
| AR | 5 | 5 | -1 | 12 | 9 | -3 | 44% | 51% | |
| KS | 119 | 118 | -1 | 123 | 123 | 0 | 97% | 96% | |
| AL | 27 | 27 | -1 | 33 | 33 | 0 | 82% | 80% | |
| LA | 447 | 433 | -14 | 455 | 457 | 2 | 98% | 95% | |
| OK | 189 | 189 | 0 | 196R | 199 | 2 | 96% | 95% | |
| TX | 523 | 515 | -9 | 533 | 533 | -1 | 98% | 97% | |
| Total | 1,488R | 1,460 | -28 | 1,557R | 1,558 | -1 | 96% | 94% | |
| Lower 48 | 4,363R | 4,317 | -46 | 4,691R | 4,725 | 34 | 93% | 91% | |
|
Source: Form EIA-191, Monthly Natural Gas Underground Storage Report Note:: Design capacity information for all facilities, including inactive fields, is available in the Natural Gas Annual Respondent Query System. Totals and calculations may not equal the sum of the components because of independent rounding. Information about storage regions is available at Storage Basics. Mentions of specific companies in this report include only information that is publicly available in EIA’s query system. (1) Demonstrated maximum working gas volume, or peak capacity, is the sum of the highest storage inventory levels of working gas observed in each distinct storage reservoir over the previous five-year period as reported by the operator on the Form EIA- 191, Monthly Underground Gas Storage Report. The timing of the peaks for different facilities needs not coincide. Inactive fields were removed from aggregate statistics. (2) Working gas design capacity, or design capacity, is an estimate of a natural gas facility's physical working gas capacity as reported by the operator on the Form EIA-191 Monthly Underground Natural Gas Storage Report. It represents the sum of all fields' capacities at a point in time. It is a measure based on the physical characteristics of the reservoir, installed equipment, and operating procedures particular to the site that is often certified by Federal or state regulators. Inactive fields were removed from aggregate statistics. (3) Demonstrated maximum working gas volume in some cases exceeds 100% of design capacity. This is because design capacity limits may differ from actual capacity limits in storage fields, as determined by the facility operator and local regulations. Demonstrated maximum working gas volume more commonly exceeds design capacity in states with a smaller number of facilities and smaller total storage volumes. (4) The design capacity and demonstrated peak capacity of Southern California Gas Company’s Aliso Canyon field were included in this report and in the Pacific region totals. Although this field was largely unavailable during 2017 for storage service, it technically met EIA’s criteria as an active storage facility. |
|||||||||
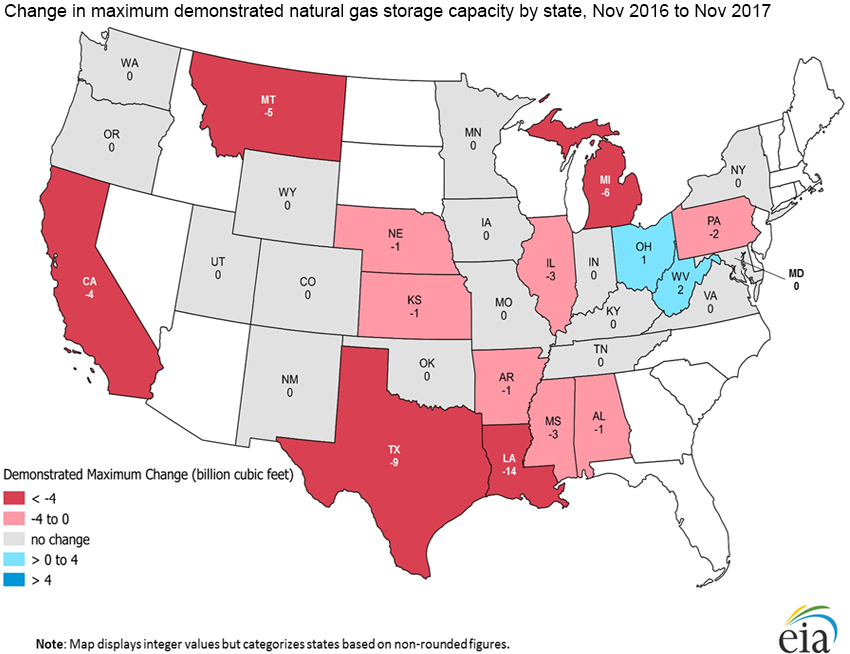
Several big capacity increases in the East region: Looking at state-level data, the two largest absolute increases in design capacity occurred in the East region. Capacity in Ohio increased by 21 Bcf, or 9%. Four separate projects in the state each expanded by 2 Bcf or more. The only two facilities that became inactive in 2017 were also located in Ohio, but their total capacity was less than 0.5 Bcf. Capacity in West Virginia increased by 8 Bcf, or 3%. West Virginia saw the capacity of six facilities expand in 2017, two of which expanded by more than 1 Bcf. In percentage terms, Arkansas saw the biggest change in capacity, decreasing by 27%, but the actual decrease was only 3 Bcf. The decrease occurred at Black Hills Energy’s Lone Elm/Henson Sand facility, one of only two storage facilities in the state.
Several decreases in demonstrated peaks across states: Many states showed decreases in their maximum demonstrated storage levels. Louisiana’s demonstrated peak fell by 14 Bcf, or 3%. This drop occurred because of previous peaks reached in 2012 fell off of the most recent five-year range (covering December 2012 to November 2017). Texas’ demonstrated peak similarly fell by 9 Bcf, or 2%, for the same reason. Only two states showed increases in demonstrated peaks: West Virginia and Ohio, which are both in a region with growing production and expanding infrastructure.


