Highlights
World marketed energy consumption is projected to increase by 57 percent
from 2004 to 2030. Total energy demand in the non-OECD countries increases
by 95 percent, compared with an increase of 24 percent in the OECD countries. |
In the IEO2007 reference case—which reflects a scenario where current laws
and policies remain unchanged throughout the projection period—world marketed
energy consumption is projected to grow by 57 percent over the 2004 to
2030 period. Total world energy use rises from 447 quadrillion British
thermal units (Btu) in 2004 to 559 quadrillion Btu in 2015 and then to
702 quadrillion Btu in 2030 (Figure 1). Global energy demand grows despite
the relatively high world oil and natural gas prices that are projected
to persist into the mid-term outlook.
The most rapid growth in energy demand from 2004 to 2030 is projected for
nations outside the Organization for Economic Cooperation and Development
(non-OECD nations). Total non-OECD energy demand increases by 95 percent
in the IEO2007 reference case projection, as compared with an increase
of 24 percent in OECD energy use. The robust growth in demand among the
non-OECD nations is largely the result of strong projected economic growth.
In all the non-OECD regions combined, economic activity—as measured by
GDP in purchasing power parity terms—increases by 5.3 percent per year
on average, as compared with an average of 2.5 percent per year for the
OECD economies.
Trends in end-use sector energy consumption can vary widely, according
to the level and pace of economic development in a given region. In the
OECD region, where energy markets generally are well established, demand
for delivered energy in each of the end-use sectors grows more slowly than
in the non-OECD nations (Figure 2). For the industrial sector, energy-intensive
industries continue to expand more rapidly in the non-OECD countries, where
investors are attracted by lower costs and fewer environmental constraints,
than in the OECD countries. In 1980, the OECD accounted for 52 percent
of the world’s industrial sector energy use. In 2004 the OECD share had
fallen to 44 percent, and it is projected to decline to 33 percent in 2030,
as non-OECD industrial energy use outpaces that in the OECD (Figure 3).
For the OECD countries, industrial sector energy use is projected to grow
at an average rate of 0.6 percent per year from 2004 to 2030; for the non-OECD
countries, the projected increase averages 2.5 percent per year.
As in the industrial sector, energy use in the buildings and transportation
sectors is projected to grow more slowly in the OECD countries than in
the non-OECD countries in the IEO2007 reference case. With slow or declining
population growth in many OECD nations, generally slow growth in energy
use in the buildings sectors is projected, averaging 0.6 percent per year
in the residential sector and 1.1 percent per year in the commercial sector
from 2004 to 2030. For the non-OECD region as a whole, strong growth in
demand for energy is projected in the buildings sectors, averaging 2.4
percent per year in the residential sector and 3.7 percent per year in
the commercial sector.
Historically, growth in transportation activity has been linked closely
to income growth, indicating a strong relationship between per-capita GDP
and passenger car travel per capita, especially in countries with developing
economies. With robust economic growth projected for the developing non-OECD
nations, transportation sector energy use increases by an average of 2.9
percent per year from 2004 to 2030, requiring extensive investment in the
construction of transportation infrastructure (highways, fueling stations,
airport facilities, rail systems, etc.) to support the fast-paced growth
in demand. In the OECD countries, where extensive infrastructure is in
place already and GDP is projected to grow much more slowly, demand for
transportation fuels increases by 0.9 percent per year.
The IEO2007 reference case projects increased world consumption of marketed
energy from all sources over the 2004 to 2030 projection period (Figure
4). Fossil fuels (petroleum and other liquid fuels,1 natural gas, and coal)
are expected to continue supplying much of the energy used worldwide. Liquids
supply the largest share of world energy consumption over the projection
period, but their share falls from 38 percent in 2004 to 34 percent in
2030, largely in response to a reference case scenario in which real world
oil prices remain near the current level through 2030. Liquids remain the
dominant energy source, given their importance in the transportation and
industrial end-use sectors; however, their share of the world energy market
in this year’s outlook is lessened in the projection, as other fuels replace
liquids where possible outside those sectors. Fossil fuel prices in the
reference case also support renewed interest in expanding the use of nuclear
power and renewable energy sources to generate electricity.
World use of petroleum and other liquids grows from 83 million barrels
oil equivalent per day in 2004 to 97 million barrels per day in 2015 and
118 million barrels per day in 2030 in the reference case.2 In most regions
of the world, the role of liquid fuels outside the transportation sector
continues to erode. Liquids remain the most important fuels for transportation,
because there are few alternatives that can compete widely with petroleum-based
liquid fuels. On a global basis, the transportation sector accounts for
68 percent of the total projected increase in liquids use from 2004 to
2030, followed by the industrial sector, which accounts for another 27
percent of the increase.
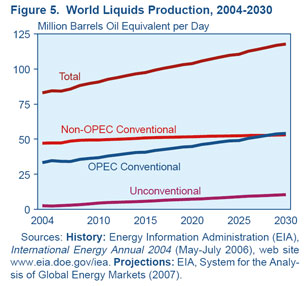
To meet the increment in world liquids demand in the reference case, total
supply in 2030 is projected to be 35 million barrels per day higher than
the 2004 level of 83 million barrels per day. Conventional liquids production
by members of the Organization of the Petroleum Exporting Countries (OPEC)
contributes about 21 million barrels per day to the total increase, and
conventional liquids production in non-OPEC countries adds another 6 million
barrels per day (Figure 5). Unconventional resources (including biofuels,
coal-to-liquids, and gas-to-liquids) from both OPEC and non-OPEC sources
are expected to become increasingly competitive. World production of unconventional
resources, which totaled only 2.6 million barrels per day in 2004, is projected
to increase to 10.5 million barrels per day and account for 9 percent of
total world liquids supply in 2030, on an oil equivalent basis, in the
IEO2007 reference case.
Natural gas consumption increases on average by 1.9 percent per year in
the reference case, from a world total of 99.6 trillion cubic feet in 2004
to 129.0 trillion cubic feet in 2015 and 163.2 trillion cubic feet in 2030.
Rising world oil prices after 2015 increase the demand for—and then the
price of—natural gas, as it is used to displace the use of liquids in the
industrial and electric power sectors. Although natural gas prices vary
by region, they tend to rise as demand increases. Higher natural gas prices,
in turn, make coal more cost-competitive, especially in the electric power
sector. Among the end-use sectors, the industrial sector remains the largest
consumer of natural gas worldwide, accounting for 43 percent of the world’s
total projected natural gas consumption in 2030.
Coal is the fastest-growing energy source worldwide in the IEO2007 reference
case projections. World coal consumption is projected to increase from
114.5 quadrillion Btu in 2004 to 199.1 quadrillion Btu in 2030, at an average
annual rate of 2.2 percent. World coal consumption increased sharply from
2003 to 2004, largely because of a 17-percent increase on a Btu basis in
non-OECD Asia (mainly, China and India). Coal’s share of total world energy
use is projected to increase from 26 percent in 2004 to 28 percent in 2030.
The electric power sector accounts for about two-thirds of the world’s
coal consumption throughout the projection period, and the industrial sector
accounts for most of the remainder. China’s industrial sector is projected
to account for about 78 percent of the total net increase in industrial
coal use worldwide. China has abundant coal resources, limited reserves
of oil and natural gas, and a leading position in world steel production.
World net electricity generation grows by 85 percent in the IEO2007 reference
case, from 16,424 billion kilowatthours in 2004 to 22,289 billion kilowatthours
in 2015 and 30,364 billion kilowatthours in 2030. Most of the projected
increase in electricity demand is in the non-OECD nations, where electricity
generation increases on average by 3.5 percent per year from 2004 to 2030,
as compared with 1.3 percent per year in the OECD nations. Coal and natural
gas remain the most important fuels for electricity generation throughout
the projection period, together accounting for 80 percent of the total
increment in world electric power generation from 2004 to 2030 in the reference
case (Figure 6).
Electricity generation from nuclear power is projected to increase from
2,619 billion kilowatthours in 2004 to 3,619 billion kilowatthours in 2030.
Higher fossil fuel prices, energy security concerns, improved reactor designs,
and environmental considerations are expected to improve the prospects
for new nuclear power capacity in many parts of the world, and a number
of countries are expected to build new nuclear power plants. In the IEO2007
reference case, the world’s installed nuclear capacity grows from 368 gigawatts
in 2004 to 481 gigawatts in 2030. Declines in nuclear capacity are projected
only in OECD Europe, where several countries (including Germany and Belgium)
have either plans or mandates to phase out nuclear power, and where some
older reactors are expected to be retired and not replaced.
Nuclear power generation in the non-OECD countries is projected to increase
by 4.0 percent per year from 2004 to 2030. The largest increase in installed
nuclear generating capacity is expected in non-OECD Asia, where annual
increases in nuclear capacity average 6.3 percent and account for 68 percent
of the total projected increase in nuclear power capacity for the non-OECD
region as a whole. Of the 58 gigawatts of additional installed nuclear
generating capacity projected for non-OECD Asia between 2004 and 2030,
36 gigawatts is projected for China and 17 gigawatts for India. Russia
also is expected to add substantial nuclear generating capacity over the
mid-term projection, increasing capacity by 20 gigawatts.
The use of hydroelectricity and other grid-connected renewable energy sources
is expected to continue to expand over the projection period, increasing
by 1.9 percent per year, at the same rate of growth as natural gas consumption
in the reference case. Higher fossil fuel prices, particularly for natural
gas in the electric power sector, allow renewable energy sources to compete
economically in some areas. Where they are not economically competitive
with fossil fuels, renewable energy sources may be supported by government
policies and incentives. The renewables share of total world energy consumption
is expected to rise from 7 percent in 2004 to 8 percent in 2030.
Much of the growth in renewable energy consumption is projected to come
from mid- to large-scale hydroelectric facilities in non-OECD Asia and
Central and South America, where several countries have hydropower facilities
either planned or under construction. Outside of Canada and Turkey, hydropower
capacity is not expected to grow substantially in the OECD nations, because
most hydroelectric resources in the region already have been developed
or lie far from population centers. Instead, most of the increase in OECD
renewable energy consumption is expected to be in the form of nonhydroelectric
resources, such as wind, solar, geothermal, municipal solid waste, and
biomass.
In recent years, atmospheric concentrations of carbon dioxide—one of the
most important greenhouse gases in the atmosphere—have been increasing
at a rate of about 0.5 percent annually. Because anthropogenic (human-caused)
emissions of carbon dioxide result primarily from the combustion of fossil
fuels for energy, energy use has emerged at the center of the climate change
debate. World carbon dioxide emissions continue to increase steadily in
the IEO2007 reference case, from 26.9 billion metric tons in 2004 to 33.9
billion metric tons in 2015 and 42.9 billion metric tons in 2030, an increase
of 59 percent over the projection period.
From 2003 to 2004, carbon dioxide emissions from the non-OECD countries
grew by almost 10 percent, largely because of a 17-percent increase in
coal use in non-OECD Asia, while emissions from the OECD countries grew
by less than 2 percent. The result of the large increase in non-OECD emissions
was that 2004 marked the first time in history that energy-related carbon
dioxide emissions from the non-OECD countries exceeded those from the OECD
countries—although by only about 8 million metric tons (Figure 7). Further,
because the projected average annual increase in emissions from 2004 to
2030 in the non-OECD countries (2.6 percent) is more than three times the
increase projected for the OECD countries (0.8 percent), carbon dioxide
emissions from the non-OECD countries in 2030, at 26.2 billion metric tons,
are projected to exceed those from the OECD countries by 57 percent.
Notes and Sources |