EIA Home > Petroleum > This Week In Petroleum
|
|
This Week In Petroleum EIA Home > Petroleum > This Week In Petroleum |
|
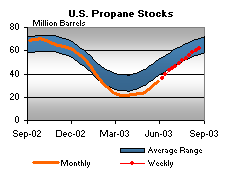
Released on August 27, 2003 What Happened A confluence of events has constrained gasoline supply at the same time demand has reached record levels, leading to the inevitable - higher gasoline prices. A pipeline rupture in Arizona on July 30 led to a complete shutdown of the pipeline on August 8, leaving many gasoline stations in Phoenix not just with much higher prices, but with no gasoline at all. The power blackout on August 14 resulted in the temporary shutdown of three refineries in the Midwest region (PADD 2). Key refineries in California have also experienced some problems and an unconfirmed report of a refinery outage along the East Coast added to the supply concerns. While the U.S. gasoline market may have been able to handle any one of these supply problems separately, it was the combination of all of these problems that exacerbated the price increase. Typically, when the U.S. average retail price for gasoline rises, it is caused by one of two factors. Either it can be traced to a large increase in the price of crude oil (the main explanation for the price increase seen in March 2003), or it is related to a gasoline problem in a key part of the country that helps to raise the national average (the price increases in June 2000 and May 2001 are examples of this). What is somewhat unique about the increase experienced this month is that crude oil prices have been relatively stable, although still much higher than over the last several years, and the supply problems have been widespread across the country. Thus, it would be very difficult, or maybe even impossible, to find a community in the country that has not seen gasoline prices rise in the last couple of weeks. The American Automobile Association, which reports gasoline prices across all 50 states on a daily basis, shows that between Aug. 1 and Aug. 26 all states showed an increase in prices with only three states (Arkansas, Hawaii, and Montana), along with the District of Columbia, showing a price increase of less than a dime. The reason why prices increased across every jurisdiction this time is that the combination of supply problems occurred at the same time as the country experienced record demand, forcing many companies to try and secure additional sources of supply. With inventories already low, there was not enough gasoline available to fully replace lost refinery production and meet increased demand. However, the sizeable 5.7-million-barrel draw last week clearly indicates that companies drew down about as much as they could. Imports, another source of additional supply, would take too long to arrive and might even arrive after prices would have dropped, so they do not provide a near-term solution. Thus, many companies attempted to buy gasoline from the refining capital of the world, the U.S. Gulf Coast. As a result, states that are normally supplied by the Gulf Coast even saw their prices rise substantially. Gulf Coast gasoline that might normally feed North Carolina, for instance, was now partially being diverted to supply the areas with supply problems. There is only so much gasoline available in the country right now and with record demand (demand for the four weeks ending August 22 averaged more than 9.4 million barrels, the highest ever four-week average recorded), it’s an economic fact that prices would rise. Of course, that leads into the next question EIA has been asked recently, “When will prices begin to fall”? Previously, EIA has stated that prices were likely to rise through Labor Day. However, wholesale prices recently have started to fall (although this may change) and with the record increase seen last week, it is less clear which direction prices will go over the next week. However, with demand typically falling substantially after Labor Day, and with resolutions to some of the supply problems already underway, it is likely that prices should fall substantially beginning sometime in September. How fast and how soon they will drop is too difficult to know right now. But for consumers, there is some comfort knowing that at some point in the coming weeks, retail gasoline prices should begin to drop again. U.S. Retail Gasoline Prices Increase at Record Pace Retail diesel fuel prices increased last week by 0.5 cent per gallon as of August 25 to a national average of 150.3 cents per gallon, which is 13.3 cents per gallon higher than a year ago. Retail diesel prices were up throughout most of the country last week, with the Rocky Mountain region seeing the largest price increase of 2.9 cents per gallon. Regionally, the highest average price in the country was in the West Coast, where prices averaged 170.7 cents per gallon, while the Lower Atlantic region averaged the lowest retail diesel price in the country at 143.5 cents per gallon as of August 25. Weekly Propane Build Slows Note: Text from the previous editions of "This Week In Petroleum" is now accessible through a link at the top right-hand corner of this page. |
||||||||||||||||||||||||||||||||||||||||||||||||||||||||||||||||
|
||||||||||||||||||||||||||||||||||||||||||||||||||||||||||||||||
|
||||||||||||||||||||||||||||||||||||||||||||||||||||||||||||||||
|
||||||||||||||||||||||||||||||||||||||||||||||||||||||||||||||||
|
|