EIA Home > Petroleum > This Week In Petroleum
|
|
This Week In Petroleum EIA Home > Petroleum > This Week In Petroleum |
|
Released on February 16, 2005 An Oil Market Urban Legend
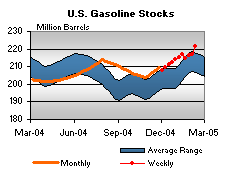
As can be seen in the chart above, demand for oil products, at least in the developed countries that belong to the Organization for Economic Cooperation and Development (OECD), where accurate data is readily available, does decline in the second quarter. The seasonality in overall oil product demand is mostly related to the demand for heating fuels, which peak in the first and fourth quarters of the year, and are relatively low in the second and third quarters. But crude oil demand in these same countries, defined as crude oil inputs into refineries, varies very little from quarter to quarter. What is happening, of course, is that refiners continue to run at almost the same rate in the second quarter and use this period to replace or rebuild inventories of heating fuels so that they can be used in the fourth and first quarters of the year. For example, heating oil inventories usually reach their nadir at the end of the first quarter, and without a substantial build over the next several months, refineries would not be able to supply enough heating oil to meet subsequent peak demand. If refiners dramatically reduced their crude oil inputs in the second quarter, not only would they not make enough gasoline for its peak demand period, but heating oil inventories would start the next winter season at extremely low levels. With little spare refinery capacity available, refineries need to maintain a steady stream of inputs, as there is little capability to "catch up" or dramatically increase production on a "real-time" basis to meet individual product demand peaks. (Even if more capacity did exist, transportation lags would discourage timely, local inventory builds.) This analysis does not even take into account the crude oil input seasonal pattern in China, which, as the second largest oil product consuming country in the world, has a large influence on crude oil buying patterns. While data for China is not readily available, its crude oil buying patterns are also unlikely to exhibit a large drop in the second quarter. Crude oil production decisions by leading OPEC members can have a large impact on global oil markets. While it is true that oil products are made from crude oil and that demand for these products drops significantly in the second quarter, it does not follow that crude oil demand also drops, thus necessitating a cut in oil production during this period to prevent prices from falling dramatically. In fact, over the last 10 years (1995-2004), the average spot price for West Texas Intermediate (WTI) crude oil has dropped in the second quarter compared to the first quarter only 5 times, while the other 5 years have seen WTI prices increase over the second quarter. Clearly then, the notion that crude oil prices will fall dramatically in the second quarter of the year due to a drop in oil product demand is an urban legend, as the demand for crude oil is expected to be especially strong in the second quarter this year, with EIA estimating that world oil product demand will be 1.9 million barrels per day higher this second quarter than last year's second quarter. With oil product demand continuing to exhibit such strong annual growth, refiners will need to maintain their input of crude oil at or above its current level in the second quarter of 2005. U.S. Average Retail Gasoline Falls Another Penny
Retail diesel fuel prices gained 0.3 cent last week to 198.6 cents per gallon. Prices were mixed throughout the country, with the West Coast seeing the largest regional increase of 7.7 cents to 219.0 cents per gallon. Prices in the Midwest lost 0.3 cent to 193.5 cents per gallon. East Coast prices dropped 1.2 cents to reach 201.3 cents per gallon, while prices in New England stayed the highest in the nation, falling 2.5 cents to 219.7 cents per gallon. However, California prices are catching up to New England, increasing by 5.2 cents to 219.6 cents per gallon, which is 33.0 cents higher than this time last year. Residential Heating Fuel Prices Show Little Change The average residential propane price decreased 0.1 cent, from 172.3 cents to 172.2 cents per gallon. This was an increase of 18.7 cents over the 153.5 cents per gallon average for this same time last year. Wholesale propane prices increased 0.5 cent per gallon, from 81.1 cents to 81.6 cents per gallon, a gain of 5.7 cents compared to the same period last year. Propane Inventories Seasonally Lower Text from the previous editions of �This Week In Petroleum� is now accessible through a link at the top right-hand corner of this page. |
||||||||||||||||||||||||||||||||||||||||||||||||||||||||||||||||
|
||||||||||||||||||||||||||||||||||||||||||||||||||||||||||||||||
|
||||||||||||||||||||||||||||||||||||||||||||||||||||||||||||||||
|
||||||||||||||||||||||||||||||||||||||||||||||||||||||||||||||||
|
|