Release date: April 11, 2018 | Next release date: April 18, 2018
Retail gasoline prices this summer are expected to be 11% higher than in summer 2017
The U.S. Energy Information Administration (EIA) forecasts that drivers in the United States will pay an average of $2.74 per gallon (gal) this summer for regular gasoline, an increase of 11% over last summer, according to EIA's Short-Term Energy and Summer Fuels Outlook. EIA's forecast price for summer 2018 (which runs from April through September) is 26 cents/gal higher than the average price last summer, but still 15 cents/gal lower than the 2013–2017 summer average (Figure 1). The price increase this summer primarily reflects higher forecast crude oil prices compared with last year. EIA projects that monthly average gasoline prices will remain mostly flat this summer, averaging $2.78/gal from April through June before falling to $2.65/gal in September.

For all of 2018, EIA forecasts U.S. regular gasoline prices to average $2.64/gal. Based on this price, EIA estimates the average household will spend about $190 (4.7%) more on gasoline in 2018 than in 2017 but about $130 (2.9%) less than in 2014, when retail gasoline prices averaged higher than $3.00/gal.
Gasoline prices are made up of four main components: crude oil prices, wholesale margins, retail distribution costs, and taxes. Because the latter two are generally stable, movements in gasoline prices have been primarily caused by changes in crude oil prices and wholesale margins. Each dollar per barrel (b) of sustained price change in crude oil and/or gasoline wholesale margins translates into an average 2.4-cent-per-gallon change in product prices.

Gasoline prices in the United States have tended to reflect changes in the Brent global crude oil benchmark. EIA forecasts that the Brent price will average $63/b ($1.50/gal) this summer, about $12/b ($0.29/gal) higher than last summer. Crude oil prices have increased this year, in part because of extensions to the coordinated crude oil production reductions by the Organization of the Petroleum Exporting Countries (OPEC). These extensions helped contribute to global liquid inventories falling by an average of 0.6 million barrels per day (b/d) in 2017. This decrease marked the first year of global inventory draws since 2013, gradually putting upward pressure on crude oil prices during the year as the oil market increasingly perceived a return toward balance. As a result, Brent crude oil prices averaged $64/b in December 2017, $10/b above January 2017. EIA expects inventories to build again in 2018, in part because continued strong growth in U.S. crude oil production should keep crude oil prices mostly unchanged over the forecast period.
Gasoline prices also have a seasonal component and typically increase following the winter into the spring and summer when gasoline demand is higher and gasoline specifications change from winter-grade gasoline to spring- and summer-grade gasoline. Summer-grade gasoline is more costly to manufacture. Along with increasing demand, this higher manufacturing cost is reflected in wholesale gasoline margins (the difference between the wholesale price of gasoline and Brent crude oil price), which typically decrease in the winter and increase in the summer.
This summer, wholesale gasoline margins are expected to average 46 cents/gal, about 2 cents/gal lower than last summer but still 2 cents/gal higher than the previous five-year summer average. Despite lower margins, EIA projects that continued growth in gasoline exports and higher domestic consumption will help gasoline yields to increase this summer, with gasoline production averaging about 170,000 b/d (2.1%) more than last summer. Projected motor gasoline consumption for summer of 2018 averages 9.6 million b/d, up slightly (0.2%) from last summer. EIA projects that summer highway travel will increase by 1.3%, but its effect on motor gasoline use will be partially offset by a 1.2% increase in fleet-wide fuel efficiency. Last summer, highway travel had increased by 1.2%.
Any difference in crude oil prices or refinery margins from EIA's baseline forecast would be reflected in retail gasoline prices. The values of futures and options contracts traded during the five-day period ending April 5, 2018 continue to suggest high uncertainty in the oil price outlook. For example, EIA's forecast for the average WTI price in December 2018 of $57/b should be considered in the context of NYMEX contract values for December 2018 delivery. Contracts traded during the five-day period ending April 5 suggest the market expects West Texas Intermediate (WTI) prices could range from $42/b to $89/b (at the 95% confidence interval) in December 2018. Additionally, prices for gasoline and other petroleum products are particularly sensitive to unplanned refinery outages, and any sudden loss of gasoline supply from the market could cause retail prices to be higher than forecast.
Regional differences in retail gasoline prices can be significant, and EIA forecasts average summer prices to range from a low of $2.45/gal on the Gulf Coast to $3.22/gal on the West Coast. Prices on the West Coast are often the highest in the country because California requires a blend of gasoline that is relatively costly to produce, and some states in the region have higher state tax rates than the national average. Gulf Coast prices are often among the lowest in the country because the region generally has low state tax rates and abundant gasoline supplies, as it is home to about half of all U.S. refining capacity.
U.S. average regular gasoline price decreases, diesel price increases
The U.S. average regular gasoline retail price fell nearly 1 cent from the previous week to $2.69 per gallon on April 9, 2018, but was up 27 cents from the same time last year. Midwest prices declined nearly two cents to $2.55 per gallon, and East Coast and Gulf Coast prices declined nearly one cent to $2.64 per gallon and $2.42 per gallon, respectively. Rocky Mountain prices increased four cents to $2.64 per gallon and West Coast prices rose slightly, remaining virtually unchanged at $3.33 per gallon.
The U.S. average diesel fuel price increased slightly, remaining virtually unchanged at $3.04 per gallon on April 9, 2018, 46 cents higher than a year ago. Rocky Mountain prices rose over four cents to $3.09 per gallon and West Coast prices rose over one cent to $3.50 per gallon. Gulf Coast and Midwest prices each declined nearly one cent to $2.84 per gallon and $2.96 per gallon, respectively. East Coast prices were unchanged at $3.07 per gallon.
Propane/propylene inventories decline
U.S. propane/propylene stocks decreased by 0.4 million barrels last week to 35.8 million barrels as of April 6, 2018, 10.3 million barrels (22.4%) lower than the five-year average inventory level for this same time of year. East Coast inventories decreased by 0.2 million barrels, Rocky Mountain/West Coast and Midwest inventories each decreased by 0.1 million barrels, while Gulf Coast inventories increased by 0.1 million barrels. Propylene non-fuel-use inventories represented 7.8% of total propane/propylene inventories.
For questions about This Week in Petroleum, contact the Petroleum Markets Team at 202-586-4522.
Retail prices (dollars per gallon)


| Retail prices | Change from last | ||
|---|---|---|---|
| 04/09/18 | Week | Year | |
| Gasoline | 2.694 | -0.006 | 0.270 |
| Diesel | 3.043 | 0.001 | 0.461 |
Futures prices (dollars per gallon*)


| Futures prices | Change from last | ||
|---|---|---|---|
| 04/06/18 | Week | Year | |
| Crude oil | 62.06 | NA | 9.82 |
| Gasoline | 1.955 | NA | 0.209 |
| Heating oil | 1.958 | NA | 0.330 |
| *Note: Crude oil price in dollars per barrel. Markets were closed on 3/30/2018. | |||
Stocks (million barrels)


| Stocks | Change from last | ||
|---|---|---|---|
| 04/06/18 | Week | Year | |
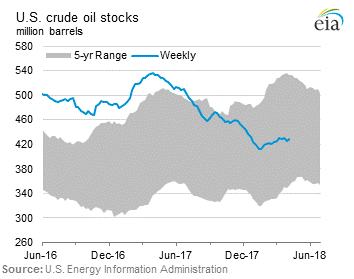
| Crude oil | 428.6 | 3.3 | -104.7 |
| Gasoline | 238.9 | 0.5 | 2.8 |
| Distillate | 128.4 | -1.0 | -21.8 |
| Propane | 35.832 | -0.417 | -4.535 |