Release date: September 19, 2018 | Next release date: September 26, 2018
U.S. oil companies increase capital expenditure budgets and discuss Permian constraints in second-quarter 2018 financial statements
Second-quarter 2018 financial results for 45 U.S. oil exploration and production companies that the U.S. Energy Information Administration (EIA) regularly tracks reveal that most companies increased their capital expenditure budgets for 2018 compared with initial budgets made at the beginning of the year. Although some operators plan to increase drilling activity as a result of higher oil prices in 2018, some companies are also raising capital expenditure budgets because of several large corporate acquisitions. These companies’ second-quarter 2018 financial statements also discussed Permian Basin takeaway capacity constraints. Because of the constraints, some operators with a geographically diverse portfolio of upstream assets plan to redirect capital expenditures to other onshore U.S. regions, while others may reduce well completions or look for alternative higher-cost transportation options.
More than 80% of the combined crude oil and other liquids production for these 45 companies in the second quarter of 2018 came from the United States, accounting for approximately one-third of total U.S. crude oil and natural gas liquids production for the quarter. Because these 45 companies are large, publicly traded, and focused on oil production, they are generally representative of the U.S. oil exploration and production industry.
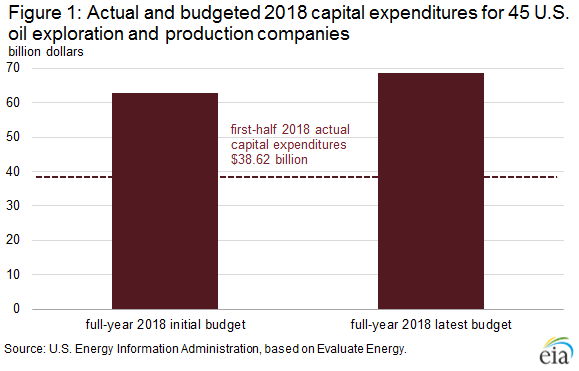
Of the 45 companies, 26 announced an increase in capital expenditure budgets since they made initial estimates at the beginning of 2018, 5 announced a decrease, and 14 announced no change. In aggregate, capital expenditure budgets of the entire group were 9% higher than initial estimates, from $63 billion to $68 billion (Figure 1). Some producers listed an increase in drilling activity as a driver of the capital expenditure budget increases, particularly as higher crude oil prices have generated higher cash flow available for investment.
Increased corporate acquisitions and reserves purchases were other contributing factors to higher capital expenditures. These 45 companies have announced $63 billion in asset purchases and corporate acquisitions through September 18 of this year. With available data going back to 2011, total 2018 expenditures on acquisition activity are on pace to meet or surpass the previous high in 2014, which had $83 billion in U.S. upstream acquisition spending during the year (Figure 2).

Concho Resources announced its purchase of RSP Permian on March 28, 2018, in an all-stock transaction valued at approximately $9.5 billion. Diamondback Energy announced two acquisitions within a week in August—the acquisition of all leasehold interests and assets of Ajax Resources, valued at about $1.2 billion, followed by the acquisition of Energen Corporation, valued at about $9.2 billion. Although not part of EIA’s 45 regularly followed U.S. oil companies, BP acquired a significant portion of BHP Billiton’s onshore U.S. assets for $10.5 billion, representing another large transaction of onshore U.S. shale play acreage.
In addition to revising capital expenditure budgets for the year, several U.S. oil companies with operations in the Permian region of Texas and New Mexico discussed increasing transportation constraints in the region. Insufficient pipeline takeaway capacity in the Permian Basin has contributed to significant crude oil price declines in the region compared with the U.S. Gulf Coast. The price of Permian crude oil reached more than $20 per barrel below Gulf Coast crude oil in August and in September. EIA expects these constraints to persist through mid-2019.
As a result of these constraints, some producers with a geographically diverse portfolio of upstream assets announced plans in their second-quarter earnings releases to redirect capital expenditures from the Permian Basin to other regions. Noble Energy, for example, announced the reallocation of capital expenditures from the Permian to other U.S. onshore basins because of the transportation constraints. Outside of the Permian, Noble Energy has U.S. onshore operations in the Denver-Julesburg Basin in Colorado and in the Eagle Ford region in Texas.
Recent rig count data, although limited, may already support producers’ planned migration from the Permian to other regions. The Baker Hughes rig count for the week ending September 14 shows a week-over-week increase of seven U.S. oil rigs. The Permian region’s oil rig count declined by 1 rig, which is a decrease of 3 rigs since reaching an almost four-year high of 486 oil rigs in August 2018. The Permian region was the only region to decline for the week ending September 14, with oil rigs increasing by one in the Mississippian, one in the Williston, two in the Denver-Julesburg/Niobrara, and four in the Baker Hughes rig count’s Others category.
Another option available to Permian producers is to reduce the number of well completions to slow the rate of production growth. EIA’s September Drilling Productivity Report (DPR) estimates that Permian region well completions have declined since March 2018, totaling 425 completions in August. The number of wells drilled is outpacing those completed, leading to the largest recorded monthly increase in drilled but uncompleted wells for the Permian region (Figure 3). Other DPR regions are not consistently increasing drilled but uncompleted wells because they do not face similar infrastructure constraints.

The increase in capital expenditures supports increases in U.S. crude oil production growth in 2019. How takeaway capacity constraints in the Permian region will ultimately affect the volume of oil produced until more capacity is added, however, remains uncertain. Third-quarter 2018 financial results will be released in November 2018.
U.S. average regular gasoline and diesel prices increase
The U.S. average regular gasoline retail price increased nearly 1 cent from last week to $2.84 per gallon on September 17, 2018, up 21 cents from the same time last year. Midwest prices increased over two cents to $2.76 per gallon, West Coast and Rocky Mountain prices each rose nearly a cent to $3.34 per gallon and $3.01 per gallon, respectively, and East Coast prices increased less than a cent, remaining virtually unchanged at $2.79 per gallon. Gulf Coast prices decreased over a cent to $2.56 per gallon.
The U.S. average diesel fuel price increased 1 cent from last week to $3.27 per gallon on September 17, 2018, 48 cents higher than a year ago. Gulf Coast prices rose nearly two cents to $3.06 per gallon, Midwest prices increased over a cent to $3.21 per gallon, West Coast prices increased nearly a cent to $3.76 per gallon, and East Coast prices increased less than a cent, remaining at $3.25 per gallon. Rocky Mountain prices decreased less than a cent to $3.36 per gallon.
Propane/propylene inventories rise slightly
U.S. propane/propylene stocks increased by 0.1 million barrels last week to 74.8 million barrels as of September 14, 2018, 9.5 million barrels (11.3%) lower than the five-year (2013-2017) average inventory level for this same time of year. Midwest and East Coast inventories increased by 0.4 million barrels and 0.1 million barrels, respectively, while Gulf Coast inventories decreased by 0.3 million barrels and Rocky Mountain/West Coast inventories decreased slightly, remaining virtually unchanged. Propylene non-fuel-use inventories represented 2.4% of total propane/propylene inventories.
For questions about This Week in Petroleum, contact the Petroleum Markets Team at 202-586-4522.
Retail prices (dollars per gallon)


| Retail prices | Change from last | ||
|---|---|---|---|
| 09/17/18 | Week | Year | |
| Gasoline | 2.841 | 0.008 | 0.207 |
| Diesel | 3.268 | 0.010 | 0.477 |
Futures prices (dollars per gallon*)

| Futures prices | Change from last | ||
|---|---|---|---|
| 09/14/18 | Week | Year | |
| Crude oil | 68.99 | 1.24 | 19.10 |
| Gasoline | 1.970 | 0.000 | 0.308 |
| Heating oil | 2.209 | -0.009 | 0.410 |
| *Note: Crude oil price in dollars per barrel. | |||
Stocks (million barrels)


| Stocks | Change from last | ||
|---|---|---|---|
| 09/14/18 | Week | Year | |
| Crude oil | 394.1 | -2.1 | -78.7 |
| Gasoline | 234.2 | -1.7 | 18.0 |
| Distillate | 140.1 | 0.8 | 1.3 |
| Propane | 74.752 | 0.110 | -6.054 |