Release date: May 22, 2019 | Next release date: May 30, 2019
U.S. gasoline prices are slightly below 2018 levels heading into Memorial Day weekend, but are expected to rise
Heading into the 2019 Memorial Day weekend, regular gasoline prices averaged $2.85 per gallon (gal) nationally on May 20, 7 cents lower than last year's price of $2.92/gal before the holiday weekend (Figure 1). Although the national average price of regular retail gasoline has decreased for two weeks in a row, the U.S. Energy Information Administration (EIA) expects U.S. regular retail gasoline prices will average $2.92/gal during the 2019 summer driving season (April through September), 7 cents/gal higher than last summer, according to EIA's May Short-Term Energy Outlook. Strong gasoline demand, falling gasoline inventories, and higher gasoline refining margins will likely drive the price increase, as crude oil spot prices are expected to remain below year-ago price levels.
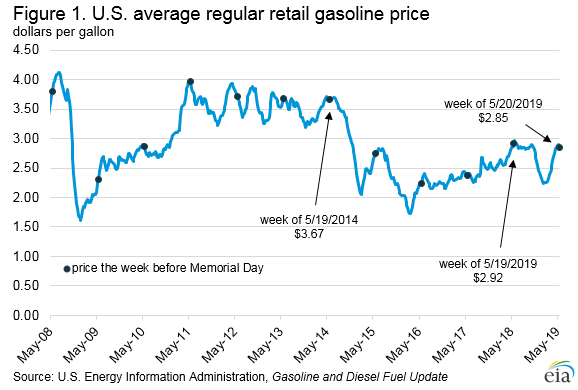
For all of 2019, EIA projects that U.S. regular gasoline prices will average $2.74/gal. The price of gasoline typically increases during the spring because of the switch from winter-grade gasoline to the more expensive summer-grade gasoline. This year, the average price for regular gasoline has increased by 16 cents/gal (6%) since the start of summer driving season in April.
Higher gasoline consumption is putting additional upward pressure on prices. As of May 10, 2019, the four-week average U.S. demand was 9.4 million barrels per day (b/d), approximately 44,000 b/d higher than the four-week average on May 11, 2018. AAA (in association with IHS Markit) expects almost 43 million Americans will travel via passenger car, train, and plane this weekend, 1.5 million more travelers than last year and the highest travel volume since 2005.
Decreasing gasoline inventories, including finished gasoline and gasoline blending components, are also contributing to the increase in gasoline prices. Although inventories were higher than the five-year (2014-2018) range at the start of the 2019, they decreased to lower than the five-year average in April and have remained about five million barrels lower than the five-year average throughout May (Figure 2).

EIA research indicates that the international benchmark Brent crude oil spot price is generally more important than the West Texas Intermediate (WTI) spot price in determining U.S. gasoline prices. Although the Brent price has increased since the beginning of 2019, it remains below year-ago levels. Brent crude oil averaged $71.25 per barrel (b) the week of May 10, 2019. This price is a $16.94 (31%) increase from the first week of 2019, but represents a $5.43/b (7%) year-over-year decrease from the same week in 2018. EIA expects Brent crude oil prices during the 2019 summer season to average $72.55/b, or $2.31/b lower than last summer. If converted from barrels to gallons, this amount equals an almost 6 cent/gal decrease.
Despite lower crude oil prices, EIA forecasts that gasoline prices will be slightly higher this summer compared with last summer primarily because EIA expects gasoline refining margins—the difference between the spot price of gasoline and the Brent crude oil spot price—will increase compared with last year as a result of the tighter gasoline market this year. U.S. gasoline margins are recovering from some of the lowest levels since 2014 in late 2018 and early 2019 (Figure 3).

Retail gasoline prices vary significantly across the United States because of regional supply and demand balances, gasoline specification requirements, and taxes (Figure 4). The U.S. Gulf Coast region, Petroleum Administration for Defense District (PADD) 3, which has more than half of U.S. refining capacity and produces more gasoline than it consumes, generally has the lowest retail gasoline prices in the country. Recently, the West Coast (PADD 5) region has seen a sharper increase in retail gasoline prices than the rest of the United States, pulling up the national average. West Coast retail gasoline prices are typically the highest in the country because of the region's tight supply and demand balance, isolation from additional supply sources, and gasoline specifications that are more costly to meet. From the beginning of 2019 through May 20, average Gulf Coast prices have been 30 cents/gal lower than the national average, and West Coast prices are 67 cents/gal higher.

U.S. average regular gasoline price decreases, diesel price increases
The U.S. average regular gasoline retail price decreased over 1 cent from the previous week to $2.85 per gallon on May 20, 7 cents lower than the same time last year. The East Coast price decreased by 3 cents to $2.72 per gallon, the West Coast price decreased by 2 cents to $3.67 per gallon, and the Gulf Coast price decreased slightly, remaining at $2.52 per gallon. The Rocky Mountain price rose almost 2 cents to $2.98 per gallon, and the Midwest price rose slightly, remaining at $2.74 per gallon.
The U.S. average diesel fuel price increased less than 1 cent to remain at $3.16 per gallon on May 20, more than 11 cents lower than a year ago. The Rocky Mountain price increased 1 cent to $3.19 per gallon, and the West Coast, Midwest, and Gulf Coast prices each increased less than 1 cent to remain at $3.79 per gallon, $3.05 per gallon, and $2.91 per gallon, respectively. The East Coast price was unchanged at $3.18 per gallon.
Propane/propylene inventories rise
U.S. propane/propylene stocks increased by 3.1 million barrels last week to 65.8 million barrels as of May 17, 2019, 11.8 million barrels (21.9%) greater than the five-year (2014-18) average inventory levels for this same time of year. Gulf Coast and Midwest inventories increased by 2.0 million barrels and 1.2 million barrels, respectively. East Coast inventories decreased by 0.1 million barrels, and Rocky Mountain/West Coast inventories decreased slightly, remaining virtually unchanged. Propylene non-fuel-use inventories represented 8.4% of total propane/propylene inventories.
For questions about This Week in Petroleum, contact the Petroleum Markets Team at 202-586-4522.
Retail prices (dollars per gallon)


| Retail prices | Change from last | ||
|---|---|---|---|
| 05/20/19 | Week | Year | |
| Gasoline | 2.852 | -0.014 | -0.071 |
| Diesel | 3.163 | 0.003 | -0.114 |
Futures prices (dollars per gallon*)


| Futures prices | Change from last | ||
|---|---|---|---|
| 05/17/19 | Week | Year | |
| Crude oil | 62.76 | 1.10 | -8.52 |
| Gasoline | 2.047 | 0.058 | -0.186 |
| Heating oil | 2.096 | 0.046 | -0.170 |
| *Note: Crude oil price in dollars per barrel. | |||
Stocks (million barrels)


| Stocks | Change from last | ||
|---|---|---|---|
| 05/17/19 | Week | Year | |
| Crude oil | 476.8 | 4.7 | 38.6 |
| Gasoline | 228.7 | 3.7 | -5.2 |
| Distillate | 126.4 | 0.8 | 12.4 |
| Propane | 65.830 | 3.120 | 24.738 |