Release date: November 20, 2019 | Next release date: November 27, 2019
EIA increases U.S. crude oil production forecast
The U.S. Energy Information Administration (EIA) revises the U.S. crude oil production forecast it publishes in each Short-Term Energy Outlook (STEO) based mainly on two factors: updates to EIA’s published historical data and EIA’s crude oil price forecast. In the November 2019 STEO, EIA increased its forecast of U.S. crude oil production in 2019 by 30,000 barrels per day (b/d) (0.2%) from the October STEO. EIA increased its 2020 crude oil production forecast by 119,000 b/d (0.9%) compared with the October STEO (Figure 1). The increases in crude oil production forecast in the November STEO were primarily driven by
- EIA’s upward revision to historical production in the Lower 48 states of about 90,000 b/d for August, based on EIA’s most recent–October 31, 2019–914 monthly crude oil and natural gas production survey
- Higher initial production for future wells that will be drilled in the Texas Permian region
- Slightly higher crude oil price forecast for the November 2019–January 2020 time period than in the October STEO

In the November STEO, EIA increased its U.S. benchmark West Texas Intermediate (WTI) crude oil price forecast by $2 per barrel (b) in November to $56/b and by $1/b in both December and January to $55/b and $54/b, respectively. The slight increase in crude oil prices also contributed to EIA’s increased production forecast for the first half of 2020 because of EIA’s assumption of a six-month lag between a crude oil price change and a production response.
In the November STEO, EIA now forecasts U.S. crude oil production will increase to 12.3 million b/d in 2019 from 11.0 million b/d in 2018. Production in the Permian region is the primary driver of EIA’s forecast crude oil production growth, and EIA forecasts Permian production will grow by 915,000 b/d in 2019 and by 810,000 b/d in 2020 (Figure 2). Increases in Permian production are supported by the crude oil pipeline infrastructure expansion seen earlier this year, which helped alleviate the transportation bottleneck and supported prices for WTI in Midland, Texas (the price producers may expect to receive in the Permian region), relative to prices for WTI-Cushing. The higher relative prices in the Permian should continue to encourage production in the region. EIA forecasts that the Bakken region will have the next largest crude oil production growth in 2019, and it is forecast to grow by 152,000 b/d in 2019 and 96,000 b/d in 2020. EIA forecasts that production in the Federal Offshore Gulf of Mexico will increase by 138,000 b/d in 2019 and 116,000 b/d in 2020.

Although EIA forecasts that overall U.S. crude oil production will increase, EIA expects the growth rate to decline from 11.8% in 2019 to 8.1% in 2020. One of the primary indicators of a slowdown in production growth is the decline in oil-directed rigs. According to Baker Hughes, active rig counts fell from 877 oil-directed rigs in the beginning of January 2019 to 674 rigs in mid-November. Rig counts in the Permian region also declined during this period, falling from 487 to 408 (Figure 3). Because EIA expects WTI-Cushing crude oil prices to stay below $55/b until August 2020, EIA anticipates that drilling rigs will continue to decline as producers cut back on their capital spending, resulting in notable slowing in the growth of domestic crude oil production over the next 14 months.

Although U.S. rig counts are declining, improvements in rig efficiency, which allows fewer rigs to drill the same number of wells, partially offset declining rig counts. In addition, higher initial production from wells (although not necessarily the total estimated ultimate recovery) is offsetting some of the slowdown in rigs.
U.S. average regular gasoline prices fall, diesel prices increase slightly
The U.S. average regular gasoline retail fell more than 2 cents from the previous week to $2.59 per gallon on November 18, 2 cents lower than the same time last year. The West Coast price fell by more than 5 cents to $3.54 per gallon, the Gulf Coast price fell by more than 4 cents to $2.22 per gallon, the East Coast price fell by more than 2 cents to $2.45 per gallon, and the Midwest price fell less than 1 cent, remaining at $2.44 per gallon. The Rocky Mountain price increased by nearly 2 cents to $2.84 per gallon.
The U.S. average diesel fuel price rose by less than 1 cent to remain at $3.07 per gallon on November 18, 21 cents lower than a year ago. The Rocky Mountain price increased by nearly 3 cents to 3.23 per gallon, and the East Coast price rose by less than 1 cent, remaining at $3.05 per gallon. The Gulf Coast price fell by less than 1 cent to $2.79 per gallon, and the West Coast and Midwest prices each decreased by less than 1 cent, remaining at $3.76 per gallon and $2.97 per gallon, respectively.
Propane/propylene inventories decline
U.S. propane/propylene stocks decreased by 3.4 million barrels last week to 94.2 million barrels as of November 15, 2019, 5.8 million barrels (6.6%) greater than the five-year (2014-18) average inventory levels for this same time of year. Gulf Coast and Midwest inventories decreased by 2.5 million barrels and 1.5 million barrels, respectively. East Coast inventories increased by 0.5 million barrels, and Rocky Mountain/West Coast inventories increased slightly, remaining virtually unchanged. Propylene non-fuel-use inventories represented 5.4% of total propane/propylene inventories.
Residential heating fuel prices
As of November 18, 2019, residential heating oil prices averaged almost $2.99 per gallon, more than 1 cent per gallon above last week’s price but 33 cents per gallon below last year’s price at this time. Wholesale heating oil prices averaged nearly $2.06 per gallon, almost 3 cents per gallon more than last week’s price but nearly 13 cents per gallon less than a year ago.
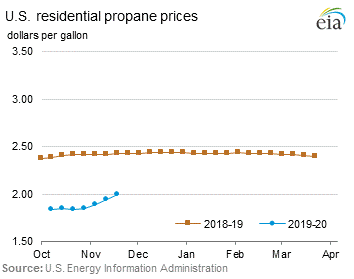
Residential propane prices averaged more than $1.99 per gallon, 5 cents per gallon higher than last week’s price but more than 43 cents per gallon lower than a year ago. Wholesale propane prices averaged nearly $0.85 per gallon, almost 9 cents per gallon higher than last week’s price but nearly 6 cents per gallon below last year’s price.
Retail prices (dollars per gallon)


| Retail prices | Change from last | ||
|---|---|---|---|
| 11/18/19 | Week | Year | |
| Gasoline | 2.592 | -0.023 | -0.019 |
| Diesel | 3.074 | 0.001 | -0.208 |
| Heating Oil | 2.985 | 0.013 | -0.331 |
| Propane | 1.992 | 0.050 | -0.433 |
Futures prices (dollars per gallon*)


| Futures prices | Change from last | ||
|---|---|---|---|
| 11/15/19 | Week | Year | |
| Crude oil | 57.72 | 0.48 | 1.26 |
| Gasoline | 1.635 | 0.001 | 0.058 |
| Heating oil | 1.948 | 0.030 | -0.126 |
| *Note: Crude oil price in dollars per barrel. | |||
Stocks (million barrels)


| Stocks | Change from last | ||
|---|---|---|---|
| 11/15/19 | Week | Year | |
| Crude oil | 450.4 | 1.4 | 3.5 |
| Gasoline | 220.8 | 1.8 | -4.5 |
| Distillate | 115.7 | -1.0 | -3.5 |
| Propane | 94.210 | -3.443 | 12.434 |