Release date: January 15, 2020 | Next release date: January 23, 2020
EIA forecasts that crude oil prices will fall during the first half of 2020, then increase through 2021
In the U.S. Energy Information Administration’s (EIA) January Short-Term Energy Outlook (STEO), EIA forecasts that the Brent crude oil spot price will average $65 per barrel (b) in 2020 and $68/b in 2021 (Figure 1). EIA forecasts that the West Texas Intermediate (WTI) spot price will average $59/b in 2020 and $62/b in 2021. EIA forecasts that crude oil prices will remain elevated in the first few months of 2020, reflecting a price premium on crude oil from recent geopolitical events. However, this price premium will diminish in the first half of 2020 and market fundamentals will drive the crude oil price forecast in the second half of 2020 and in 2021.

Several geopolitical events have provided upward pressure on crude oil prices in recent months. These events include attacks on oil tankers transiting the Persian Gulf and the Red Sea, the September 2019 attack on Saudi Arabia’s energy infrastructure, and recent tensions between the United States and Iran.
Although the immediate price spike following the mid-September attacks on Saudi Arabia was relatively short-lived, the attacks contributed to an increased price risk. As a result, monthly average Brent prices rose from $63/b in September to $67/b in December. Crude oil prices increased during this period despite global liquid fuels inventories growing by 130,000 barrels per day (b/d). Further increasing the geopolitical risk premium on global oil prices, the U.S. military action in Iraq in January 2020 increased uncertainty about potential disruptions to oil production and shipping in the Middle East. Following these developments, the price of Brent crude oil reached $70/b, but prices have subsequently fallen.
As the risk premium decreases, EIA assumes that Brent prices will decline in early 2020 to an average of $62/b in May. EIA does not forecast supply disruptions, and any physical supply disruptions would put upward pressure on prices.
In the first half of 2020, EIA expects significant liquid fuels supply growth. Production restraint from members of the Organization of the Petroleum Exporting Countries (OPEC) and several non-member countries (OPEC+), most notably Russia, and accelerating global demand growth will be more than offset by non-OPEC production, largely in the United States, Norway, Brazil, and Canada. EIA forecasts an average global stock build of 520,000 b/d in the first half of the year, which will put downward pressure on crude oil prices (Figure 2). However, later in 2020 and in 2021, non-OPEC production growth (particularly from U.S. tight oil) will slow significantly, which will contribute to tightening market balances and upward pressure on crude oil prices. Although the pace of global economic growth and resulting changes to oil consumption remain uncertain, EIA expects liquid fuels consumption growth to increase from 2019 levels.

In December, OPEC+ announced an agreement to deepen production cuts through March 2020. The group is now targeting production that is 1.7 million b/d lower than in October 2018, compared with the former target reduction of 1.2 million b/d. EIA forecasts that 2020 OPEC crude oil production will average 29.2 million b/d and 2021 production will average 29.3 million b/d, down from an average of 29.8 million b/d in 2019. In the forecast, OPEC production remains lower than 2019 levels because EIA assumes that OPEC will limit production through all of 2020 and 2021 to maintain balanced global oil markets and because of continuing production declines in Venezuela and Iran.
The crude oil price forecast is also driven by a forecast that global economic growth will be higher in 2020 than in 2019. Based on forecasts from Oxford Economics, EIA adjusted its global oil-weighted gross domestic product (GDP) growth forecast for 2020 up slightly to 2.4% and further to almost 3.0% in 2021, up from GDP growth of 1.9% in 2019. EIA forecasts that global liquid fuels consumption will increase by 1.3 million b/d in 2020 and 1.4 million b/d in 2021. On December 13, the Office of the United States Trade Representative announced that the United States and China reached an agreement for a trade deal, which was signed on January 15. Global trade conditions are among the many factors that may influence the pace of economic growth in the coming quarters.
EIA forecasts that non-OPEC liquid fuels production will increase by 2.6 million b/d in 2020 and by 0.9 million b/d in 2021. Growth in 2020 is largely driven by production increases in the United States, Norway, Brazil, and Canada. Total U.S. liquid fuels production is forecast to increase by 1.7 million b/d in 2020, but production growth slows to 0.6 million b/d in 2021. Most U.S. liquids production growth is from crude oil, which will grow by 1.1 million b/d in 2020 and by 0.4 million b/d in 2021. EIA expects that crude oil production growth will slow as a result of declining rig counts. However, EIA forecasts that production will continue to grow as a result of rig efficiency and well productivity that is expected to rise during the forecast period.
EIA forecasts that combined liquids production in Norway, Brazil, and Canada will grow, averaging 860,000 b/d in 2020 and 450,000 b/d in 2021. In Norway, Phase 1 of the Johan Sverdrup field came online in October 2019 and EIA forecasts that it will drive most of Norway’s production growth during the forecast period. In Brazil, seven floating production, storage, and offloading vessels (FPSO) came online in 2018 and 2019 and are now producing at maximum or near maximum capacity. FPSOs will continue to be the main driver of growth in Brazil; at least four more are expected online through 2023. EIA expects that Canada’s production growth will accelerate compared with 2019 as the Alberta government’s production curtailments are reduced and more rail takeaway capacity gives producers an outlet for supplies.
U.S. average regular gasoline and diesel prices decline
The U.S. average regular gasoline retail price fell nearly 1 cent from the previous week to $2.57 per gallon on January 13, 32 cents higher than the same time last year. The Rocky Mountain price fell more than 3 cents to $2.61 per gallon, the East Coast price declined 2 cents to $2.52 per gallon, the West Coast price fell nearly 1 cent to $3.20 per gallon, and the Gulf Coast price fell less than 1 cent, remaining at $2.28 per gallon. The Midwest price rose nearly 1 cent to $2.44 per gallon.
The U.S. average diesel fuel price fell nearly 2 cents from the previous week to $3.06 per gallon on January 13, 9 cents higher than a year ago. The Rocky Mountain price fell nearly 4 cents to $3.07 per gallon, the West Coast price fell more than 2 cents to $3.59 per gallon, the Gulf Coast price fell nearly 2 cents to $2.81 per gallon, the Midwest price fell more than 1 cent to $2.97 per gallon, and the East Coast price fell nearly 1 cent to $3.11 per gallon.
Propane/propylene inventories decline
U.S. propane/propylene stocks decreased by 0.9 million barrels last week to 87.9 million barrels as of January 10, 2020, 15.0 million barrels (20.6%) greater than the five-year (2015-19) average inventory levels for this same time of year. Gulf Coast, East Coast, and Midwest inventories decreased by 0.4 million barrels, 0.3 million barrels, and 0.2 million barrels, respectively. Rocky Mountain/West Coast inventories remained unchanged. Propylene non-fuel-use inventories represented 7.0% of total propane/propylene inventories.
Residential heating oil prices decrease, propane prices increase
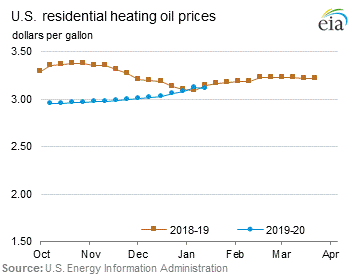
As of January 13, 2020, residential heating oil prices averaged nearly $3.11 per gallon, 1 cent per gallon below last week’s price and 3 cents per gallon lower than last year’s price at this time. Wholesale heating oil prices averaged more than $2.03 per gallon, almost 14 cents per gallon lower than last week’s price but more than 5 cents per gallon higher than a year ago.
Residential propane prices averaged almost $2.01 per gallon, less than 1 cent per gallon above last week’s price but nearly 42 cents per gallon less than a year ago. Wholesale propane prices averaged $0.64 per gallon, 2 cents per gallon lower than last week’s price and more than 14 cents per gallon below last year’s price.
For questions about This Week in Petroleum, contact the Petroleum Markets Team at 202-586-4522.
Retail prices (dollars per gallon)


| Retail prices | Change from last | ||
|---|---|---|---|
| 01/13/20 | Week | Year | |
| Gasoline | 2.570 | -0.008 | 0.323 |
| Diesel | 3.064 | -0.015 | 0.088 |
| Heating Oil | 3.109 | -0.010 | -0.030 |
| Propane | 2.009 | 0.004 | -0.419 |
Futures prices (dollars per gallon*)


| Futures prices | Change from last | ||
|---|---|---|---|
| 01/10/20 | Week | Year | |
| Crude oil | 59.04 | -4.01 | 7.45 |
| Gasoline | 1.660 | -0.089 | 0.259 |
| Heating oil | 1.928 | -0.133 | 0.048 |
| *Note: Crude oil price in dollars per barrel. | |||
Stocks (million barrels)


| Stocks | Change from last | ||
|---|---|---|---|
| 01/10/20 | Week | Year | |
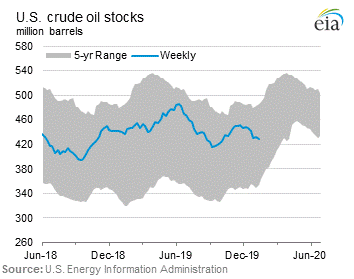
| Crude oil | 428.5 | -2.5 | -8.5 |
| Gasoline | 258.3 | 6.7 | 2.7 |
| Distillate | 147.2 | 8.2 | 4.2 |
| Propane | 87.938 | -0.947 | 20.439 |
