Release date: February 20, 2020 | Next release date: February 26, 2020
Forecast growth in demand for U.S. petroleum and other liquids is not driven by transportation and not supplied by refineries
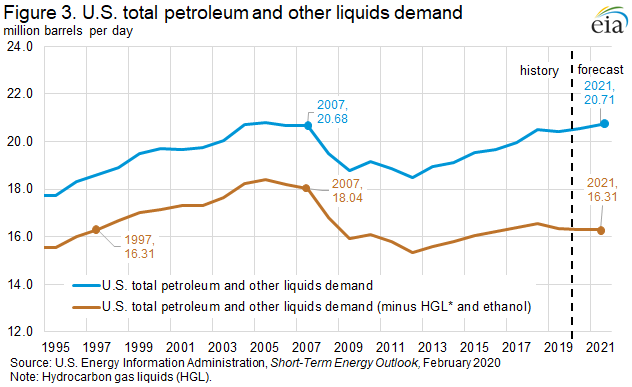
The U.S. Energy Information Administration’s (EIA) February Short-Term Energy Outlook (STEO) forecasts that in 2021, U.S. consumption (as measured by product supplied) of total petroleum and other liquid fuels will average 20.71 million barrels per day (b/d), surpassing the 2007 pre-recession level of 20.68 million b/d. However, the drivers of this consumption growth have changed. Since the 2007–09 recession, U.S. consumption growth has shifted toward liquid fuels that are used primarily outside the transportation sector and are supplied mostly from non-refinery sources. Despite this shift away from domestic demand for refinery-produced fuels, U.S. refinery runs have increased, and the excess products have been exported, greatly contributing to the United States becoming a net exporter of petroleum in September 2019. EIA expects these trends to continue for at least the next 10 years.
Hydrocarbon gas liquids (HGL) have been the main driver of U.S. petroleum and other liquids demand growth since 2007 (Figure 1). U.S. production and consumption of HGLs—a group of products that include ethane, propane, normal butane and isobutane, natural gasoline, and refinery olefins—have risen with increased natural gas production and demand from an expanding petrochemical sector. As a result, EIA forecasts U.S. HGL consumption will be 1.27 million b/d more in 2021 than in 2007, and will average 3.45 million b/d.

With the exception of jet fuel, EIA expects less U.S. consumption of refinery-produced products in 2021 than in 2007. Since 2007, increases in U.S. vehicle miles traveled, which normally increases total motor gasoline consumption, have been countered to some extent by increases in vehicle fuel efficiency. In addition, although U.S. total motor gasoline consumption exceeded 2007 levels for the first time in 2016, increased blending of ethanol into finished motor gasoline has displaced some of the petroleum-based, or refinery-produced, portion of gasoline consumption. Therefore, EIA forecasts 570,000 b/d less consumption of refinery-produced gasoline in the United States in 2021 than in 2007, while ethanol will be 0.5 million b/d higher. Ethanol is almost exclusively produced at non-petroleum refinery sites.
Some HGLs can be produced by both refineries and natural gas processing plants. Natural gas plant liquids (NGPLs)—a subset of HGLs that includes ethane, propane, normal butanes and isobutanes, and natural gasoline—can be extracted from natural gas production streams or produced at refineries that process crude oil. However, as U.S. natural gas production increased from 55.3 billion cubic feet per day (Bcf/d) in 2007 to 98.9 Bcf/d in 2019, the amount of HGLs extracted from natural gas production increased from 1.78 million b/d in 2007 to 4.83 million b/d in 2019. EIA expects HGL production from natural gas processing plants to continue to increase to 5.47 million b/d in 2021. Meanwhile, refinery HGL production has been flat at about 600,000 b/d (Figure 2).

Although HGLs have several different end uses, such as propane for space heating and normal butane for blending with motor gasoline, most of the growth in consumption stems from the use of HGLs as feedstock for petrochemical processes. The large increase in U.S. production of HGLs, and the resulting low prices, led to large investments in U.S. infrastructure to extract and transport HGLs to market, as well as investments in petrochemical facilities to consume it. Many of these facilities consume ethane, and to a lesser degree propane and normal butane, as feedstocks to produce intermediate building blocks for plastics, resins, and other materials with nonenergy uses. EIA forecasts that U.S. ethane consumption will reach 1.96 million b/d in 2021, up from 743,000 b/d in 2007, which represents 96% of the increase in U.S. HGL consumption between 2007 and 2021.
Removing HGL and ethanol consumption from the total demand for U.S. petroleum and other liquids indicates that EIA’s 2021 forecast U.S. demand for principally refinery-produced products is about 16.31 million b/d, on par with the 1997 level (Figure 3).
Despite domestic demand shifting away from traditionally refinery-produced products, U.S. refinery capacity has increased 1.7 million b/d between 2007 and 2019. U.S. refineries have adapted to falling domestic demand for certain products, such as residual fuel, by investing in downstream coking capacity to upgrade it into more valuable products. More importantly, international demand for refinery-produced products has increased since 2007, allowing U.S. refineries to increase runs and utilization beyond what the domestic market demanded to supply products to export markets. As a result, the United States became a net exporter on an annual basis of distillate and residual fuel in 2008, of jet fuel in 2011, and of motor gasoline in 2016.
Similarly, demand for HGLs outside of the United States has increased and caused U.S exports of HGLs to increase from 70,000 b/d in 2007 to 2.07 million b/d in November 2019. Between 2013 and 2016, exports of HGLs were the largest contributor to the increase in U.S. exports of petroleum products. U.S. exports of HGLs are mostly of propane and ethane to markets in Asia and Europe, where they are also displacing refinery-produced naphtha as a petrochemical feedstock.
EIA projects that these trends of increasing U.S. production of HGLs, increasing domestic consumption of HGLs, and increasing exports of HGLs will continue beyond 2021. EIA’s Annual Energy Outlook 2020 (AEO2020), released in January, shows projections for further growth in HGL production at natural gas processing plants from 4.91 million b/d in 2019 to a peak of 6.58 million b/d in 2029 and then slowly decline to 6.17 million b/d by 2050. Domestic consumption of HGLs will also increase, driven by continued petrochemical demand for feedstock, which rises from about 3.14 million b/d in 2019 to more than 4.0 million b/d in 2029. Meanwhile, in the AEO2020 Reference case, U.S. consumption of motor gasoline declines until 2042, distillate consumption declines until 2040, and residual fuel consumption continues declining out to 2050.
U.S. average regular gasoline prices rise, diesel prices decline
The U.S. average regular gasoline retail price increased nearly 1 cent from the previous week to $2.43 per gallon on February 17, 11 cents higher than the same time last year. The Midwest price rose nearly 5 cents to $2.31 per gallon. The Rocky Mountain price fell more than 3 cents to $2.47 per gallon, the West Coast price fell 1 cent to $3.14 per gallon, the East Coast price fell nearly 1 cent to $2.36 per gallon, and the Gulf Coast price declined by less than 1 cent to $2.08 per gallon.
The U.S. average diesel fuel price fell 2 cents from the previous week to $2.89 per gallon on February 17, 12 cents lower than a year ago. The Rocky Mountain price fell nearly 4 cents to $2.86 per gallon, the East Coast price fell more than 2 cents to $2.94 per gallon, the Midwest and Gulf Coast prices each fell nearly 2 cents to $2.76 per gallon and $2.66 per gallon, respectively, and the West Coast price fell more than 1 cent to $3.47 per gallon.
Residential heating oil prices increase, propane prices decrease
As of February 17, 2020, residential heating oil prices averaged more than $2.91 per gallon, almost 1 cent per gallon above last week’s price but more than 31 cents per gallon lower than last year’s price at this time. Wholesale heating oil prices averaged $1.80 per gallon, more than 5 cents per gallon above last week’s price but 34 cents per gallon lower than a year ago.
Residential propane prices averaged more than $1.98 per gallon, less than 1 cent per gallon below last week’s price and nearly 45 cents per gallon less than a year ago. Wholesale propane prices averaged more than $0.56 per gallon, more than 1 cent per gallon higher than last week’s price but almost 27 cents per gallon below last year’s price.
Propane/propylene inventories decline
U.S. propane/propylene stocks decreased by 3.0 million barrels last week to 74.3 million barrels as of February 14, 2020, 18.4 million barrels (32.9%) greater than the five-year (2015-19) average inventory levels for this same time of year. Midwest, Gulf Coast, East Coast, and Rocky Mountain/West Coast inventories decreased by 1.1 million barrels, 1.0 million barrels, 0.6 million barrels, and 0.4 million barrels, respectively. Propylene non-fuel-use inventories represented 7.5% of total propane/propylene inventories.
For questions about This Week in Petroleum, contact the Petroleum Markets Team at 202-586-4522.
Retail prices (dollars per gallon)


| Retail prices | Change from last | ||
|---|---|---|---|
| 02/17/20 | Week | Year | |
| Gasoline | 2.428 | 0.009 | 0.111 |
| Diesel | 2.890 | -0.020 | -0.116 |
| Heating Oil | 2.914 | 0.005 | -0.311 |
| Propane | 1.982 | -0.004 | -0.447 |
Futures prices (dollars per gallon*)


| Futures prices | Change from last | ||
|---|---|---|---|
| 02/14/20 | Week | Year | |
| Crude oil | 52.05 | 1.73 | -3.54 |
| Gasoline | 1.583 | 0.059 | 0.010 |
| Heating oil | 1.698 | 0.055 | -0.322 |
| *Note: Crude oil price in dollars per barrel. | |||
Stocks (million barrels)


| Stocks | Change from last | ||
|---|---|---|---|
| 02/14/20 | Week | Year | |
| Crude oil | 442.9 | 0.4 | -11.6 |
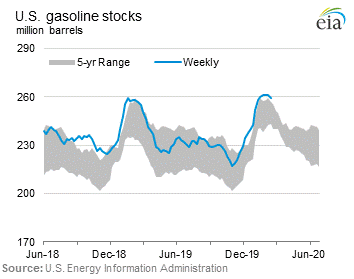
| Gasoline | 259.1 | -2.0 | 2.2 |
| Distillate | 140.6 | -0.6 | 1.9 |
| Propane | 74.260 | -3.013 | 19.661 |