Release date: March 11, 2020 | Next release date: March 18, 2020
OPEC shift to maintain market share will result in global inventory increases and lower prices
Markets for oil, as well as other commodities and equities, have experienced significant volatility and price declines since the final week in February amid concerns over the economic effects of the 2019 novel coronavirus disease (COVID-19). More recently, markets fell after the Organization of the Petroleum Exporting Countries (OPEC) and partners failed to reach an agreement to continue crude oil production cuts. The U.S. Energy Information Administration (EIA) has focused on several underlying assumptions about OPEC’s posture regarding targeted production output and what effect it may have on global oil balances and prices.
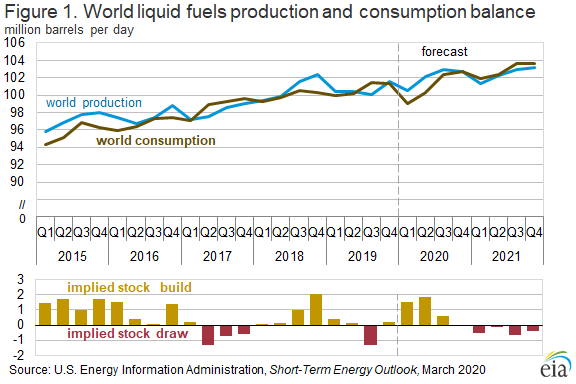
In its March Short-Term Energy Outlook (STEO), EIA forecasts Brent crude oil prices will average $43 per barrel (b) in 2020, down from an average of $64/b in 2019. For 2020, EIA expects prices will average $37/b during the second quarter and rise to $43/b during the second half of the year. EIA forecasts that average Brent prices will rise to an average of $55/b in 2021 as declining global oil inventories put upward pressure on prices. EIA expects that global liquid fuels inventories will grow by an average of 1.0 million barrels per day (b/d) in 2020 after falling by about 0.1 million b/d in 2019 and that inventory builds will be largest in the first half of 2020, rising at a rate of 1.7 million b/d (Figure 1).
After the March 6 meeting, OPEC and partner countries announced that they did not agree to extend production cuts beyond those currently expiring March 31, 2020. EIA no longer expects active production management to target balanced global oil markets among OPEC members and partner countries. These countries have been limiting production under the Declaration of Cooperation, initially agreed to in December 2016.
Because of the outcome of the March 6 OPEC meeting, EIA increased its OPEC liquid fuels production forecast by 150,000 b/d in 2020 and by 200,000 b/d in 2021 compared with the February STEO. EIA expects OPEC crude oil production will average 29.1 million b/d in the second and third quarters of 2020, up from 28.7 million b/d in the first quarter of 2020 (Figure 2). Although this growth represents a relatively small increase in a market where global production exceeded 100 million b/d in 2019, this production level represents a marked change from recent production targets that were focused on keeping global inventories near the five-year (2015–19) average. OPEC’s current strategy appears to be focused on regaining market share by elevating production levels to the point that the resulting depressed prices limit production growth from other market participants, particularly non-OPEC producers. In addition, the increase in OPEC production is significant in light of the downward revisions to the outlook for global demand resulting from COVID-19.
In recent STEO forecasts, EIA adjusted the outlook for OPEC total liquids supply based on changes in demand and non-OPEC supply to maintain global inventories that were at or near the five-year average. In the March STEO, EIA no longer assumes that OPEC production levels will follow such a pattern and now expects significant inventory builds through 2020. One way to look at these related patterns is to compare the call on OPEC with OPEC crude oil production (Figure 2). The call on OPEC represents the OPEC crude oil production level that would balance the global market. It is calculated as total global liquid fuels consumption minus non-OPEC supply minus OPEC other liquids production. When OPEC output exceeds the call on OPEC, global inventories increase, much like in 2014 through the end of 2016. From 2017 through 2019, the call on OPEC steadily declined as non-OPEC production, primarily in the United States, saw significant growth. EIA forecasts OPEC production will exceed the call on OPEC in 2020—largely because of the significant decline in global liquids demand—contributing to inventory builds.

Production levels targeted by OPEC amid low oil demand are very uncertain, and realized levels will have a significant effect on crude oil prices. Because OPEC surplus capacity is more than 2.0 million b/d, member countries could produce far more than EIA currently forecasts, which would lead to larger inventory builds and put downward pressure on prices (Figure 3).

On the other hand, higher-than-expected crude oil production outages could reduce supply and put upward pressure on prices. Crude oil production in Libya has declined by 1.0 million b/d since December 2019, and EIA estimates February production in Libya averaged 150,000 b/d. Total unplanned OPEC production outages averaged 3.84 million b/d in February and included additional outages in Iran, Kuwait, Nigeria, and Saudi Arabia (Figure 4).

U.S. average regular gasoline and diesel prices fall
The U.S. average regular gasoline retail price fell more than 4 cents from the previous week to $2.38 per gallon on March 9, 10 cents lower than a year ago. The Midwest price fell nearly 7 cents to $2.23 per gallon, the Gulf Coast price fell more than 5 cents to $2.06 per gallon, the East Coast price fell nearly 5 cents to $2.30 per gallon, the Rocky Mountain price fell nearly 4 cents to $2.38 per gallon, and the West Coast price fell more than 2 cents to $3.11 per gallon.
The U.S. average diesel fuel price fell nearly 4 cents from the previous week to $2.81 per gallon on March 9, 27 cents lower than a year ago. The Gulf Coast price fell 5 cents to $2.58 per gallon, both the East Coast price and the Midwest price declined by nearly 4 cents to $2.86 per gallon and $2.69 per gallon, respectively, and the West Coast and Rocky Mountain prices fell by more than 2 cents to $3.40 per gallon and $2.80 per gallon, respectively.
Propane/propylene inventories decline
U.S. propane/propylene stocks decreased by 2.9 million barrels last week to 67.0 million barrels as of March 6, 2020, 17.1 million barrels (34.3%) greater than the five-year (2015-19) average inventory levels for this same time of year. Gulf Coast and Midwest inventories each decreased by 1.2 million barrels, and East Coast inventories decreased 0.6 million barrels. Rocky Mountain/West Coast inventories increased by 0.1 million barrels. Propylene non-fuel-use inventories represented 8.2% of total propane/propylene inventories.
Residential heating fuel prices decrease
As of March 9, 2020, residential heating oil prices averaged almost $2.76 per gallon, nearly 7 cents per gallon below last week’s price and more than 47 cents per gallon lower than last year’s price at this time. Wholesale heating oil prices averaged almost $1.47 per gallon, nearly 14 cents per gallon below last week’s price and more than 66 cents per gallon lower than a year ago.
Residential propane prices averaged more than $1.96 per gallon, almost 1 cent per gallon below last week’s price and more than 45 cents per gallon below last year’s price. Wholesale propane prices averaged $0.53 per gallon, nearly 4 cents per gallon lower than last week’s price and almost 31 cents per gallon below last year’s price.
For questions about This Week in Petroleum, contact the Petroleum Markets Team at 202-586-4522.
Retail prices (dollars per gallon)


| Retail prices | Change from last | ||
|---|---|---|---|
| 03/09/20 | Week | Year | |
| Gasoline | 2.375 | -0.048 | -0.096 |
| Diesel | 2.814 | -0.037 | -0.265 |
| Heating Oil | 2.755 | -0.066 | -0.474 |
| Propane | 1.963 | -0.005 | -0.451 |
| Note: Heating oil and propane prices originally scheduled for release on March 11, 2020, were delayed because of technical difficulties, but the prices are now available. | |||
Futures prices (dollars per gallon*)


| Futures prices | Change from last | ||
|---|---|---|---|
| 03/06/20 | Week | Year | |
| Crude oil | 41.28 | -3.48 | -14.79 |
| Gasoline | 1.389 | -0.007 | -0.413 |
| Heating oil | 1.385 | -0.106 | -0.615 |
| *Note: Crude oil price in dollars per barrel. | |||
Stocks (million barrels)


| Stocks | Change from last | ||
|---|---|---|---|
| 03/06/20 | Week | Year | |
| Crude oil | 451.8 | 7.7 | 2.7 |
| Gasoline | 247.0 | -5.0 | 0.9 |
| Distillate | 128.1 | -6.4 | -8.3 |
| Propane | 67.031 | -2.921 | 16.872 |