Release date: March 25, 2020 | Next release date: April 1, 2020
Oil market volatility is at an all-time high
Crude oil prices have fallen significantly since the beginning of 2020, largely driven by the economic contraction caused by the 2019 novel coronavirus disease (COVID19) and a sudden increase in crude oil supply following the suspension of agreed production cuts among the Organization of the Petroleum Exporting Countries (OPEC) and partner countries. With falling demand and increasing supply, the front-month price of the U.S. benchmark crude oil West Texas Intermediate (WTI) fell from a year-to-date high closing price of $63.27 per barrel (b) on January 6 to a year-to-date low of $20.37/b on March 18 (Figure 1), the lowest nominal crude oil price since February 2002.

WTI crude oil prices have also fallen significantly along the futures curve, which charts monthly price settlements for WTI crude oil delivery over the next several years. For example, the WTI price for December 2020 delivery declined from $56.90/b on January 2, 2020, to $32.21/b as of March 24. In addition to the sharp price decline, the shape of the futures curve has shifted from backwardation—when near-term futures prices are higher than longer-dated ones—to contango, when near-term futures prices are lower than longer-dated ones. The WTI 1st-13th spread (the difference between the WTI price in the nearest month and the price for WTI 13 months away) settled at -$10.34/b on March 18, the lowest since February 2016, exhibiting high contango. The shift from backwardation to contango reflects the significant increase in petroleum inventories. In its March 2020 Short-Term Energy Outlook (STEO), released on March 11, 2020, the U.S. Energy Information Administration (EIA) forecast that Organization for Economic Cooperation and Development (OECD) commercial petroleum inventories will rise to 2.9 billion barrels in March, an increase of 20 million barrels over the previous month and 68 million barrels over March 2019 (Figure 2). Since the release of the March STEO, changes in various oil market and macroeconomic indicators suggest that inventory builds are likely to be even greater than EIA’s March forecast.

Significant price volatility has accompanied both price declines and price increases. Since 1999, 69% of the time, daily WTI crude oil prices increased or decreased by less than 2% relative to the previous trading day. Daily oil price changes during March 2020 have exceeded 2% 13 times (76% of the month’s traded days) as of March 24. For example, the 10.1% decline on March 6 after the OPEC meeting was larger than 99.8% of the daily percentage price decreases since 1999. The 24.6% decline on March 9 and the 24.4% decline on March 18 were the largest and second largest percent declines, respectively, since at least 1999 (Figure 3).

On March 10, a series of government announcements indicated that emergency fiscal and monetary policy were likely to be forthcoming in various countries, which contributed to a 10.4% increase in the WTI price, the 12th-largest daily increase since 1999. During other highly volatile time periods, such as the 2008 financial crisis, both large price increases and decreases occurred in quick succession. During the 2008 financial crisis, the largest single-day increase—a 17.8% rise on September 22, 2008—was followed the next day by the largest single-day decrease, a 12.0% fall on September 23, 2008.
Market price volatility during the first quarter of 2020 has not been limited to oil markets (Figure 4). The recent volatility in oil markets has also coincided with increased volatility in equity markets because the products refined from crude oil are used in many parts of the economy and because the COVID-19-related economic slowdown affects a broad array of economic activities. This can be measured through implied volatility—an estimate of a security’s expected range of near-term price changes—which can be calculated using price movements of financial options and measured by the VIX index for the Standard and Poor’s (S&P) 500 index and the OVX index for WTI prices. Implied volatility for both the S&P 500 index and WTI are higher than the levels seen during the 2008 financial crisis, which peaked on November 20, 2008, at 80.9 and on December 11, 2008, at 100.4, respectively, compared with 61.7 for the VIX and 170.9 for the OVX as of March 24.

Comparing implied volatility for the S&P 500 index with WTI’s suggests that although recent volatility is not limited to oil markets, oil markets are likely more volatile than equity markets at this point. The oil market’s relative volatility is not, however, in and of itself unusual. Oil markets are almost always more volatile than equity markets because crude oil demand is price inelastic—whereby price changes have relatively little effect on the quantity of crude oil demanded—and because of the relative diversity of the companies constituting the S&P 500 index. But recent oil market volatility is still historically high, even in comparison to the volatility of the larger equity market. As denoted by the red line in the bottom of Figure 4, the difference between the OVX and VIX reached an all-time high of 124.1 on March 23, compared with an average difference of 16.8 between May 2007 (the date the OVX was launched) and March 24, 2020.
Markets currently appear to expect continued and increasing market volatility, and, by extension, increasing uncertainty in the pricing of crude oil. Oil’s current level of implied volatility—a forward-looking measure for the next 30 days—is also high relative to its historical, or realized, volatility. Historical volatility can influence the market’s expectations for future price uncertainty, which contributes to higher implied volatility. Some of this difference is a structural part of the market, and implied volatility typically exceeds historical volatility as sellers of options demand a volatility risk premium to compensate them for the risk of holding a volatile security. But as the yellow line in Figure 4 shows, the current implied volatility of WTI prices is still higher than normal. The difference between implied and historical volatility reached an all-time high of 44.7 on March 20, compared with an average difference of 2.3 between 2007 and March 2020. This trend could suggest that options (prices for which increase with volatility) are relatively expensive and, by extension, that demand for financial instruments to limit oil price exposure are relatively elevated.
Increased price correlation among several asset classes also suggests that similar economic factors are driving prices in a variety of markets. For example, both the correlation between changes in the price of WTI and changes in the S&P 500 and the correlation between WTI and other non-energy commodities (as measured by the S&P Commodity Index (GSCI)) increased significantly in March. Typically, when correlations between WTI and other asset classes increase, it suggests that expectations of future economic growth—rather than issues specific to crude oil markets— tend to be the primary drivers of price formation. In this case, price declines for oil, equities, and non-energy commodities all indicate that concerns over global economic growth are likely the primary force driving price formation (Figure 5).

U.S. average regular gasoline and diesel prices fall
The U.S. average regular gasoline retail price fell nearly 13 cents from the previous week to $2.12 per gallon on March 23, 50 cents lower than a year ago. The Midwest price fell more than 16 cents to $1.87 per gallon, the West Coast price fell nearly 15 cents to $2.88 per gallon, the East Coast and Gulf Coast prices each fell nearly 11 cents to $2.08 per gallon and $1.86 per gallon, respectively, and the Rocky Mountain price declined more than 8 cents to $2.24 per gallon.
The U.S. average diesel fuel price fell more than 7 cents from the previous week to $2.66 per gallon on March 23, 42 cents lower than a year ago. The Midwest price fell more than 9 cents to $2.50 per gallon, the West Coast price fell more than 7 cents to $3.25 per gallon, the East Coast and Gulf Coast prices each fell nearly 7 cents to $2.72 per gallon and $2.44 per gallon, respectively, and the Rocky Mountain price fell more than 6 cents to $2.68 per gallon.
Propane/propylene inventories decline
U.S. propane/propylene stocks decreased by 1.8 million barrels last week to 64.9 million barrels as of March 20, 2020, 15.5 million barrels (31.3%) greater than the five-year (2015-19) average inventory levels for this same time of year. Gulf Coast inventories decreased by 1.3 million barrels, East Coast inventories decreased by 0.3 million barrels, and Rocky Mountain/West Coast inventories decrease by 0.2 million barrels. Midwest inventories increased by 0.1 million barrels. Propylene non-fuel-use inventories represented 8.5% of total propane/propylene inventories.
Residential heating fuel prices decrease
As of March 23, 2020, residential heating oil prices averaged $2.45 per gallon, almost 15 cents per gallon below last week’s price and nearly 77 cents per gallon lower than last year’s price at this time. Wholesale heating oil prices averaged more than $1.11 per gallon, almost 14 cents per gallon below last week’s price and 98 cents per gallon lower than a year ago.
Residential propane prices averaged more than $1.91 per gallon, nearly 2 cents per gallon below last week’s price and almost 49 cents per gallon below last year’s price. Wholesale propane prices averaged more than $0.42 per gallon, more than 7 cents per gallon lower than last week’s price and almost 36 cents per gallon below last year’s price.
For questions about This Week in Petroleum, contact the Petroleum Markets Team at 202-586-4522.
Retail prices (dollars per gallon)


| Retail prices | Change from last | ||
|---|---|---|---|
| 03/23/20 | Week | Year | |
| Gasoline | 2.120 | -0.128 | -0.503 |
| Diesel | 2.659 | -0.074 | -0.421 |
| Heating Oil | 2.450 | -0.145 | -0.769 |
| Propane | 1.911 | -0.018 | -0.486 |
Futures prices (dollars per gallon*)


| Futures prices | Change from last | ||
|---|---|---|---|
| 03/20/20 | Week | Year | |
| Crude oil | 22.43 | -9.30 | -36.61 |
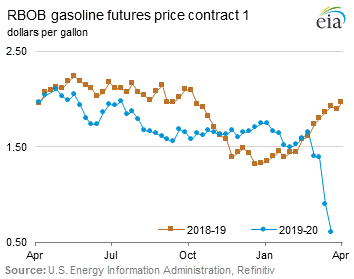
| Gasoline | 0.605 | -0.294 | -1.321 |
| Heating oil | 1.006 | -0.131 | -0.960 |
| *Note: Crude oil price in dollars per barrel. | |||
Stocks (million barrels)


| Stocks | Change from last | ||
|---|---|---|---|
| 03/20/20 | Week | Year | |
| Crude oil | 455.4 | 1.6 | 13.1 |
| Gasoline | 239.3 | -1.5 | 0.7 |
| Distillate | 124.4 | -0.7 | -5.7 |
| Propane | 64.919 | -1.811 | 13.282 |