Release date: April 15, 2020 | Next release date: April 22, 2020
EIA forecasts U.S. crude oil production to decline because of low oil prices
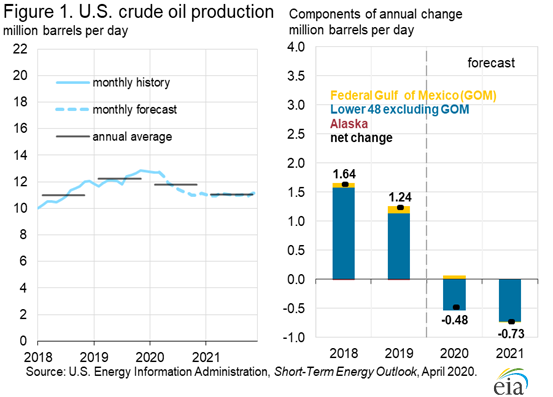
In the April 2020 update of its Short-Term Energy Outlook (STEO), released on April 7, and before a recently announced agreement by oil producing countries to limit production, the U.S. Energy Information Administration (EIA) forecasts that U.S. crude oil production will average 11.8 million barrels per day (b/d) in 2020, a 4% decline from the 2019 production levels. Crude oil production will average 11.0 million b/d in 2021, a 6% decline from 2020 (Figure 1). If realized, the STEO 2020 production decline would mark the first annual decrease since 2016. The majority of the forecasted production decline occurs between the first and fourth quarters of 2020, dropping from 12.7 million b/d to 11.0 million b/d (13%) and remaining around that level through 2021. The forecast did not incorporate the April 12 joint announcement by the Organization of the Petroleum Exporting Countries (OPEC) and several other non-OPEC countries to reduce crude oil production. These production reductions may significantly affect global balances and could provide upward price pressure that would affect U.S. crude oil drilling and production.
The significant drop in crude oil prices since early March 2020 is driving declines in capital expenditures and drilling activity. EIA’s U.S. crude oil production forecast is based on the West Texas Intermediate (WTI) April 2020 STEO price forecast, which the STEO expects to remain below $45 per barrel (b) through 2021. The STEO price forecast is highly uncertain, and any significant divergence of actual prices from the projected price path could change the pace of drilling and well completion, which would in turn affect production.
Typically, oil price changes impact production after about six months. However, current market conditions, combined with significantly reduced petroleum demand as a result of the 2019 novel coronavirus disease (COVID-19), will likely decrease this lag as many producers have already announced plans to cut capital spending and drilling levels. U.S. crude oil production declines come almost exclusively from Lower 48 states crude oil production. EIA forecasts that production in Alaska and the Federal Offshore Gulf of Mexico will remain flat through 2021 because crude oil production in these regions is driven by long-term investment that is less sensitive to short-term price movements.
EIA’s model for Lower 48 states production includes structural parameters that reduce the forecast for rigs and wells when the WTI price falls below $45/b, based on historical trends in each region. In addition to this model-based production decrease, EIA assumes a further 15% reduction in activity on average in the second quarter of 2020 and a 12% reduction in the third quarter of 2020 to account for the unprecedented effects of COVID-19 on drilling.
According to the latest Dallas Fed Energy Survey, which surveys exploration and production companies operating in Texas, New Mexico, and Louisiana, WTI prices need to average between $23/b and $36/b to cover operating expenses for existing wells, depending on the production area. In late March, some U.S. crude oil producers received prices less than $8/b, depending on the crude oil quality and its location (Figure 2). The Bakken and West Texas crude oil prices in Figure 2 represent crude oil spot prices located near production points, and the large discounts to WTI Cushing prices reflect the significant decline in refiners’ purchases of crude oil.

Although some producers used financial instruments such as swaps or options to hedge at least a portion of their 2020 production against price declines, few producers hedge 100% of their planned output, so the hedges may not cover the magnitude of the price declines. In addition, some of the financing strategies used act as only partial hedges—that is, their hedge strategy operates only within a predefined range of prices. Many operators use partial hedges to lower the cost of hedging. According to fourth-quarter 2019 financial statements filed with the U.S. Securities and Exchange Commission, all publicly traded U.S. producers collectively hedged 2.1 million b/d of crude oil for 2020 at prices ranging from about $45/b to $70/b, including both full and partial hedges. However, about 0.9 million b/d of these volumes were only partial hedges, which lose financial hedging benefits for producers at a floor price of about $40/b. Given the limitations on hedging, current oil prices could lead to asset impairments and bankruptcies among U.S. oil companies. First-quarter 2020 financial results will be released by late April and early May 2020 and will likely reveal the significant declines in capital expenditures and revenues for publicly traded U.S. crude oil producers.
U.S. average regular gasoline and diesel prices fall
On April 13, the average regular gasoline retail price for the United States fell more than 7 cents from the previous week to $1.85 per gallon, 98 cents lower than a year ago. The West Coast price fell more than 10 cents to $2.58 per gallon, the Rocky Mountain price fell nearly 9 cents to $1.92 per gallon, the Gulf Coast price fell more than 8 cents to $1.58 per gallon, the Midwest price fell nearly 8 cents to $1.55 per gallon, and the East Coast price fell more than 4 cents to $1.88 per gallon.
The U.S. average diesel fuel price fell more than 4 cents from the previous week to $2.51 per gallon on April 13, 61 cents lower than a year ago. The West Coast price fell more than 6 cents to $3.03 per gallon, the Rocky Mountain and Midwest prices each fell more than 4 cents to $2.50 per gallon and $2.35 per gallon, respectively, and the East Coast and Gulf Coast prices each fell nearly 4 cents to $2.60 per gallon and $2.29 per gallon, respectively.
Propane/propylene inventories decline
U.S. propane/propylene stocks decreased by 2.2 million barrels last week to 56.8 million barrels as of April 10, 2020, 8.7 million barrels (18.2%) greater than the five-year (2015-19) average inventory levels for this same time of year. East Coast, Gulf Coast, and Midwest inventories decreased by 1.9 million barrels, 0.4 million barrels, and 0.1 million barrels, respectively. Rocky Mountain/West Coast inventories increased by 0.1 million barrels. Beginning with the data for week ending April 10, 2020, U.S. and regional stocks of propylene reported by EIA include only barrels of propylene held at refineries; barrels of propylene held at bulk terminals are excluded. For more information please refer to the notice on the Weekly Petroleum Status Report main page.
For questions about This Week in Petroleum, contact the Petroleum Markets Team at 202-586-4522.
Retail prices (dollars per gallon)

| Retail prices | Change from last | ||
|---|---|---|---|
| 04/13/20 | Week | Year | |
| Gasoline | 1.853 | -0.071 | -0.975 |
| Diesel | 2.507 | -0.041 | -0.611 |
Futures prices (dollars per gallon*)


| Futures prices | Change from last | ||
|---|---|---|---|
| 04/09/20 | Week | Year | |
| Crude oil | 22.76 | -5.58 | -41.13 |
| Gasoline | 0.677 | -0.015 | -1.360 |
| Heating oil | 0.973 | -0.098 | -1.098 |
| *Note: Crude oil price in dollars per barrel. Markets were closed on 4/10/2020. | |||
Stocks (million barrels)


| Stocks | Change from last | ||
|---|---|---|---|
| 04/10/20 | Week | Year | |
| Crude oil | 503.6 | 19.2 | 48.5 |
| Gasoline | 262.2 | 4.9 | 34.3 |
| Distillate | 129.0 | 6.3 | 1.3 |
| Propane | 56.780 | -2.247 | 6.226 |