Release date: April 22, 2020 | Next release date: April 29, 2020
WTI crude oil futures prices fell below zero because of low liquidity and limited available storage
On Monday, April 20, 2020, New York Mercantile Exchange (NYMEX) West Texas Intermediate (WTI) crude oil front-month futures prices fell below zero dollars per barrel (b)—at one point, trading at -$40.32/b (Figure 1)—and remained below zero for part of the following trading day. Monday marked the first time the price for the WTI futures contract fell below zero since trading began in 1983. Negative prices in commodity markets are very rare, but when they occur they typically indicate high transactions costs and significant infrastructure constraints. In this case, the WTI front-month futures contract was for May 2020 delivery, and the contract was set to expire on April 21, 2020. Unless they have made other arrangements ahead of time, market participants that hold WTI futures contracts to expiration must take physical delivery of WTI crude oil in Cushing, Oklahoma. Typically, most market participants close any futures contracts ahead of expiration through cash settlement in order to avoid taking physical delivery, and only about 1% of contracts are physically settled. The extreme market events of April 20 and April 21 were driven by several factors, including the inability of contract holders to find other market participants to sell the futures contracts. In addition, in this case, the scarcity of available crude oil storage meant several market participants sold their futures contracts at negative prices, in effect paying a counterparty to close out of the contracts.

Crude oil and other commodities are traded on futures markets, which are financial exchanges that market participants use to manage risk in a variety of businesses, including but not limited to, upstream crude oil production, refining, shipping, and wealth management. Because they can be delivered physically, prices for WTI futures contracts, for the most part, converge with spot market prices after expiration. The spot market reflects cash transactions for physical buying and selling of the underlying commodity. For more information on the interaction between physical commodity markets and financial markets, the U.S. Energy Information Administration (EIA) provides explanations and updated material on its web page What Drives Crude Oil Prices?
The terms and conditions contained in the settlement procedures of the May 2020 WTI contract as stipulated by CME Group—which owns and operates the NYMEX on which the contract is traded—are key to understanding the recent price activity. On expiration, the holder of a WTI contract has two options to meet the contract's physical delivery requirement. First, up until 2:00 p.m. on the business day following the expiration date, a contract holder can settle the position by entering into an Exchange for Related Position (EFRP) contract with a counterparty, which transfers the contract to a counterparty in exchange for a spot market (also known as the ‘cash market’) position or a derivative contract corresponding to the asset underlying the Exchange contract. Second, settlement can also occur if a contract holder takes physical delivery of the crude oil. As per the NYMEX contract's specifications, delivery of the physical crude oil volumes must occur at a pipeline or storage facility in Cushing, Oklahoma, with pipeline access to Enterprise Product Partner’s crude oil terminal or Enbridge Inc.'s crude oil terminal. This delivery must also occur within a specific time, which is currently set no earlier than the first calendar day of the contract month and no later than the month's last calendar day.
Taking delivery of crude oil at Cushing under a futures contract is straightforward. Buyers can have the oil transferred into a storage facility or pipeline that they own or lease. Or, with the seller's consent, they can transfer ownership of the crude oil somewhere else in the pipeline and storage system. The relative attractiveness of the physical settlement process has been affected, however, by the recent decline in the availability of uncommitted crude oil storage capacity. Because of the impact of the 2019 novel coronavirus disease (COVID-19) on economic activity and the consumption of petroleum products, U.S. consumption of crude oil and petroleum products has sharply declined. As of the week ending April 17, U.S. refinery runs fell to 12.8 million barrels per day (b/d), 4.1 million b/d (24%) lower than the same time last year.
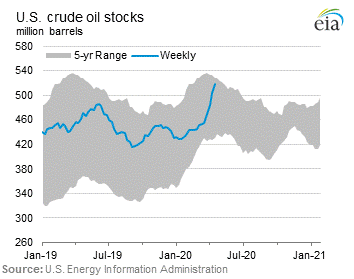
As a result of this extreme demand shock, excess imported and domestically-produced crude oil volumes have been placed into storage. Crude oil storage facilities at Cushing have 76 million barrels of working storage capacity, of which 60 million barrels (76% after accounting for pipeline fill and stocks in transit) were filled as of April 17 (Figure 2). Although Cushing has physically unfilled storage available, some of this physically unfilled storage is likely to have already been leased or otherwise committed, limiting the uncommitted storage available for contract holders without pre-existing arrangements. In this case, these contract holders would likely have to pay much higher rates to storage operators that have uncommitted space available.

Although data for storage costs are limited, the increased demand for storage has likely placed significant upward pressure on crude oil storage costs. Trade press reports of high on-land storage costs, high rates for crude oil maritime shipping (which can be used as an alternative to on-shore storage), and high levels of contango (when near-term futures prices are lower than longer-dated ones) all reflect an increase in storage costs since early March 2020. As a result, owners of the May 2020 WTI futures contract most likely had to sell at lower prices to exit their contracts and avoid relatively expensive physical settlement. In this extreme market environment, several participants had to sell at negative prices—that is, pay the other party to close out of the contract before expiration.
Theoretically, a contract holder could choose or be forced to fail to take physical delivery of the crude oil cargo, although doing so is likely to be costly. The specific costs associated with a failure to accept physical delivery depend on the specific contractual arrangements entered into by the futures contract holder and the Futures Commission Merchant (FCM)—the entity responsible for executing the buying and selling of futures contracts on behalf of a client. The possible costs could include a combination of direct monetary penalties, reputational consequences, the liquidation of the collateral deposited by the client in the margin account with the FCM, the revocation of trading privileges, and the costs of any legal settlements resulting from the breach of contractual obligations. As a result, holders of expired contracts obligated to take physical settlement rarely fail to take delivery.
Taken together, these factors suggest that the phenomenon of negative WTI prices could be confined to the financial market, with few physical market participants paying negative prices. The positive pricing of other crude oil benchmarks (with the Brent contract for June 2020 delivery closing at $19.33/b on April 21), positive prices for longer-dated WTI prices, and positive spot prices for other (but not all) U.S. crude oils suggest that the recent price action was predominantly driven by the timing of the May 2020 contract expiration. The availability of storage in Cushing will remain an issue in the coming weeks, however, and could still result in volatile price movements in the June WTI futures contract or other U.S. crude oil spot prices that face limited storage options. EIA will continue to monitor these market developments.
U.S. average regular gasoline and diesel prices fall
The U.S. average regular gasoline retail price fell more than 4 cents per gallon from the previous week to $1.81 per gallon on April 20, nearly $1.03 per gallon lower than the same time last year. The West Coast price fell nearly 7 cents to $2.52 per gallon, the Rocky Mountain price fell nearly 6 cents to $1.87 per gallon, the Midwest price fell more than 4 cents to $1.51 per gallon, and the East Coast and Gulf Coast prices each fell more than 3 cents to $1.84 per gallon and $1.54 per gallon, respectively.
The U.S. average diesel fuel price fell nearly 3 cents to $2.48 per gallon on April 20, nearly 67 cents lower than a year ago. The West Coast price fell more than 5 cents to $2.97 per gallon, the Rocky Mountain and Midwest prices each fell nearly 3 cents to $2.47 per gallon and $2.33 per gallon, respectively, the East Coast price fell more than 2 cents to $2.58 per gallon, and the Gulf Coast price fell nearly 2 cents to $2.27 per gallon.
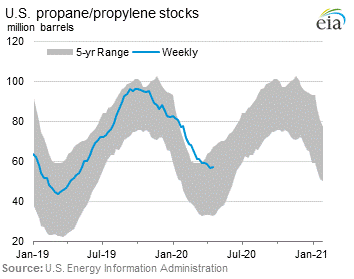
Propane/propylene inventories increase
U.S. propane/propylene stocks increased by 0.7 million barrels last week to 57.4 million barrels as of April 17, 2020, 8.6 million barrels (17.6%) greater than the five-year (2015-19) average inventory levels for this same time of year. East Coast inventories increased by 0.9 million barrels, and Rocky Mountain/West Coast and Midwest inventories each increased by 0.2 million barrels. Gulf Coast inventories decreased by 0.6 million barrels. Beginning with the data for week ending April 10, 2020, U.S. and regional stocks of propylene reported by EIA include only barrels of propylene held at refineries; barrels of propylene held at bulk terminals are excluded. For more information please refer to the notice on the Weekly Petroleum Status Report main page.
For questions about This Week in Petroleum, contact the Petroleum Markets Team at 202-586-4522.
Retail prices (dollars per gallon)


| Retail prices | Change from last | ||
|---|---|---|---|
| 04/20/20 | Week | Year | |
| Gasoline | 1.812 | -0.041 | -1.029 |
| Diesel | 2.480 | -0.027 | -0.667 |
Futures prices (dollars per gallon*)


| Futures prices | Change from last | ||
|---|---|---|---|
| 04/17/20 | Week | Year | |
| Crude oil | 18.27 | NA | NA |
| Gasoline | 0.711 | NA | NA |
| Heating oil | 0.956 | NA | NA |
| *Note: Crude oil price in dollars per barrel. Markets were closed on 4/19/2019 and 4/10/2020. | |||
Stocks (million barrels)

| Stocks | Change from last | ||
|---|---|---|---|
| 04/17/20 | Week | Year | |
| Crude oil | 518.6 | 15.0 | 58.0 |
| Gasoline | 263.2 | 1.0 | 37.4 |
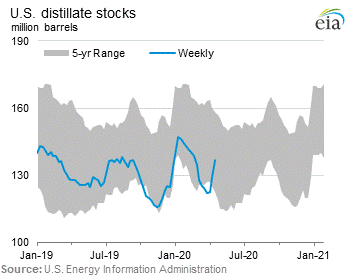
| Distillate | 136.9 | 7.9 | 9.9 |
| Propane | 57.442 | 0.662 | 5.645 |