Release date: May 6, 2020 | Next release date: May 13, 2020
Low crude oil prices, record-high inventories, and low demand drive gasoline prices down
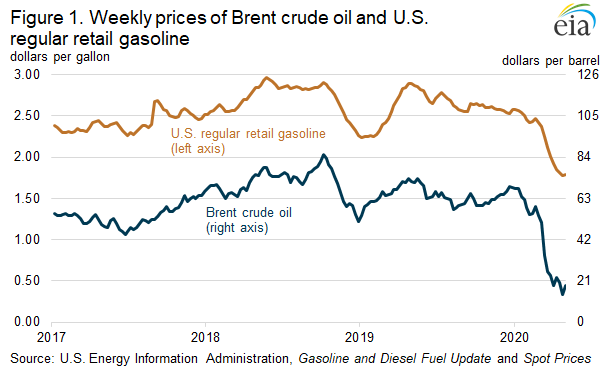
On April 27, 2020, the U.S. average regular retail gasoline price was $1.77 per gallon (gal), the lowest price since February 2016. On May 4, the U.S. average gasoline price increased slightly to $1.79/gal. The United States declared a national emergency on March 13 in response to concerns regarding spread of the 2019 novel coronavirus disease (COVID-19). From March 16 to May 4, the U.S. average regular retail gasoline price fell by $0.46/gal. The lower gasoline prices reflect low crude oil prices, low gasoline demand, and rising gasoline inventories.
As a result of reduced economic activity and stay-at-home orders aimed at slowing the spread of COVID-19, consumption of petroleum products and the price for crude oil (the primary input for producing gasoline) have both declined. The Brent crude oil price, which is generally more closely correlated than the West Texas Intermediate (WTI) price to the price of U.S. gasoline, settled at $18 per barrel (b) on May 1, down $15/b (45%) since March 13 and $53/b (74%) less than a year ago (Figure 1).
Falling crude oil prices have coincided with decreasing transportation fuel demand, placing further downward pressure on gasoline prices. U.S. gasoline consumption (as measured by the four-week rolling average of product supplied) fell from 9.3 million barrels per day (b/d) the week ending March 13 to 5.3 million b/d the week ending on April 24.
As consumption has decreased, gasoline inventories have risen to record levels despite refinery run cuts. On April 17, total U.S. gasoline inventories reached 263.2 million barrels, the highest level recorded since the U.S. Energy Information Administration (EIA) began collecting these data in 1990 (Figure 2). Gasoline inventories have since fallen slightly to 256.4 million barrels as of May 1. Although EIA does not collect weekly demand data on a regional basis, low refinery runs and high gasoline inventories indicate low demand in each region. As a result, gasoline prices have decreased in each region. In addition, the U.S. Environmental Protection Agency’s (EPA) temporary waiver of the requirement to switch to summer-grade gasoline is putting further downward pressure on gasoline prices.

From March 16 to May 4, the average regular retail price of gasoline in the West Coast (Petroleum Administration for Defense District, or PADD, 5) fell $0.58/gal to $2.44/gal, the lowest price since March 2016. The West Coast retail gasoline price is typically higher than the average U.S. price because of the region’s tight supply and demand balance, geographical isolation from other U.S. refining centers—such as the Gulf Coast (PADD 3)—because of very limited gasoline transportation infrastructure, and gasoline specifications that are more costly to manufacture. Although the May 4, 2020, West Coast gasoline price is $0.65/gal higher than the U.S. average, it is $1.27/gal less than West Coast gasoline price for the same time last year.
Total West Coast motor gasoline inventories increased by 5.0 million barrels from March 13 (when the national emergency was declared) to 35.0 million barrels on April 10, the largest inventory since 2013 (Figure 3). More recently, inventories have begun to decline, reflecting low refinery runs as gasoline inventories are drawn down. In the week ending May 1, weekly gross inputs into West Coast refineries fell to 1.7 million b/d, the least on record. The five weeks from April 3 through May 1 had the five lowest levels of West Coast refiner gross production of gasoline on record (going back to June 2010, when EIA began collecting these data). West Coast gasoline inventories have fallen during the past three weeks, but they are still higher than the previous five-year (2015–19) maximum.

Gasoline inventories in the U.S. Gulf Coast have also increased. From March 13 to May 1, Gulf Coast gasoline inventories increased by 6.8 million barrels (8%) to 89.5 million barrels. Because of refinery run cuts and decreasing refinery yields of gasoline, Gulf Coast refinery gross production of motor gasoline fell to 2.9 million b/d for the week of April 24, the lowest level on record since June 2010, when EIA began collecting these data. The week of May 1, Gulf Coast refinery gross production of motor gasoline increased slightly to 3.0 million b/d. The high inventory levels are putting downward pressure on the price of Gulf Coast gasoline, which fell to $1.49/gal on May 4, down $0.48/gal since March 16 and the lowest price since 2004. The Gulf Coast typically has the lowest retail gasoline price in the country because it has more than 50% of U.S. refining capacity and produces more gasoline than it consumes. However, the Midwest (PADD 2) had the country’s lowest gasoline price from March 30 to April 27 (Figure 4), reflecting lack of demand for gasoline in the region.

The price of motor gasoline in the Midwest was $1.57/gal as of May 4, down $0.46/gal since March 16. Midwest gasoline prices were lower than Gulf Coast prices for five consecutive weeks, the first time Midwest prices have remained lower than Gulf Coast prices for more than two consecutive weeks since December 2008. As Midwest inventories have begun to decline and Gulf Coast inventories continue to build, the Gulf Coast price has again fallen below the Midwest price.
The East Coast (PADD 1) and Rocky Mountain (PADD 4) regions have also seen falling gasoline prices. As of May 4, the East Coast price was $1.79/gal, down $0.40/gal since March 16. The Rocky Mountain price was $1.77/gal on May 4, down $0.55/gal since March 16. Like the rest of the country, both the East Coast and Rocky Mountain regions have experienced gasoline inventories higher than the previous five-year maximum.
U.S. average regular gasoline price rises, diesel price falls
The U.S. average regular gasoline retail price rose nearly 2 cents per gallon from the previous week to $1.79 per gallon on May 4, $1.11 lower than the same time last year. The Midwest price rose nearly 10 cents to $1.57 per gallon. The Rocky Mountain price fell nearly 4 cents to $1.77 per gallon, the East Coast price fell nearly 2 cents to $1.79 per gallon, the Gulf Coast price fell 2 cents to $1.49 per gallon, and the West Coast price fell more than 1 cent to $2.44 per gallon.
The U.S. average diesel fuel price fell nearly 4 cents to $2.40 per gallon on May 4, 77 cents lower than a year ago. The Rocky Mountain price fell more than 6 cents to $2.37 per gallon, the West Coast, East Coast, Midwest, and Gulf Coast prices each fell nearly 4 cents to $2.90 per gallon, $2.51 per gallon, $2.25 per gallon, and $2.17 per gallon, respectively.
Propane/propylene inventories rise
U.S. propane/propylene stocks increased by 2.5 million barrels last week to 59.4 million barrels as of May 1, 2020, 7.5 million barrels (14.5%) greater than the five-year (2015-19) average inventory levels for this same time of year. Gulf Coast inventories increased by 1.2 million barrels, Midwest inventories increased by 0.9 million barrels, and East Coast and Rocky Mountain/West Coast inventories each increased by 0.2 million barrels.
Retail prices (dollars per gallon)


| Retail prices | Change from last | ||
|---|---|---|---|
| 05/04/20 | Week | Year | |
| Gasoline | 1.789 | 0.016 | -1.108 |
| Diesel | 2.399 | -0.038 | -0.772 |
Futures prices (dollars per gallon*)


| Futures prices | Change from last | ||
|---|---|---|---|
| 05/01/20 | Week | Year | |
| Crude oil | 19.78 | 2.84 | -42.16 |
| Gasoline | 0.766 | 0.105 | -1.261 |
| Heating oil | 0.796 | 0.149 | -1.274 |
| *Note: Crude oil price in dollars per barrel. | |||
Stocks (million barrels)


| Stocks | Change from last | ||
|---|---|---|---|
| 05/01/20 | Week | Year | |
| Crude oil | 532.2 | 4.6 | 65.6 |
| Gasoline | 256.4 | -3.2 | 30.3 |
| Distillate | 151.5 | 9.5 | 25.9 |
| Propane | 59.376 | 2.540 | 5.178 |