This Week in Petroleum
Annual exports of transportation fuels from the United States decreased in 2020, but trade varied by product
Substantial disruptions in global demand for refined product in 2020 arising from responses to the COVID-19 pandemic had a mixed effect on refined product trade in the United States, according to complete monthly data for the year published in the U.S. Energy Information Administration’s (EIA) Petroleum Supply Monthly. Total U.S. refined product exports decreased in 2020, falling to their lowest point for the year in May. Decreased U.S. demand for transportation fuels also contributed to reduced annual imports, primarily of gasoline. During the second half of the year, net gasoline exports (exports minus imports) increased compared with the first half of 2020. Conversely, rising imports of distillate fuel oil in the second half of 2020 led to a decrease in net exports for that fuel. In 2020, the United States was a net importer of jet fuel for the first time in a decade.
Petroleum product exports averaged a record high of 6.3 million barrels per day (b/d) in February 2020, but the demand shock from responses to the COVID-19 pandemic resulted in substantially reduced exports of petroleum products during the first half of the year, reaching a low point of 3.9 million b/d in May. Exports of petroleum products increased in the second half of 2020 to levels near the 2019 average. However, the decreased exports in the first half of the year lead to a reduction in the 2020 annual average of total product exports from 5.5 million b/d in 2019 to 5.3 million b/d in 2020 (Figure 1). Exports of most major transportation fuels, including gasoline, distillate fuel oil, and jet fuel, declined compared with 2019 levels, although propane exports in 2020 increased to record highs and surpassed distillate as the largest petroleum product export from the United States, as discussed in previous editions of This Week in Petroleum and Today in Energy.

U.S. imports and exports of gasoline each declined in 2020 because of reduced demand; however, gasoline imports fell more than gasoline exports, driving net exports up (Figure 2). Consumption of U.S. finished motor gasoline (measured as product supplied) decreased to 8.0 million b/d in 2020, a reduction of 1.3 million b/d compared with 2019, reflecting reduced vehicle miles traveled because of responses to the COVID-19 pandemic. Lower U.S. domestic gasoline demand resulted in reduced imports of both finished motor gasoline and motor gasoline blending components, which together decreased 210,000 b/d from 2019 to 584,000 b/d in 2020. Reduced U.S. demand paralleled decreasing global demand for gasoline exports, and exports of U.S. gasoline also declined, falling 112,000 b/d from 2019 to 790,000 b/d in 2020. Gasoline imports decreased more than gasoline exports, and net U.S. exports of gasoline in 2020 averaged 205,000 b/d, or 99,000 b/d more than in 2019. Mexico was the largest importer of U.S. gasoline by a wide margin, averaging 441,000 b/d in 2020.

The next most common regional destination for U.S. gasoline exports was Central and South America, which collectively averaged 273,000 b/d during 2020. Although exports to Central and South America decreased substantially in May 2020, export volumes returned to levels closer to the five-year (2015–19) average through the second half of the year. In some months, export volumes grew higher than the five-year average, but they remained lower than 2019 levels. Exports to Asia and Oceania increased, averaging 18,000 b/d, a 6,000 b/d increase from 2019.
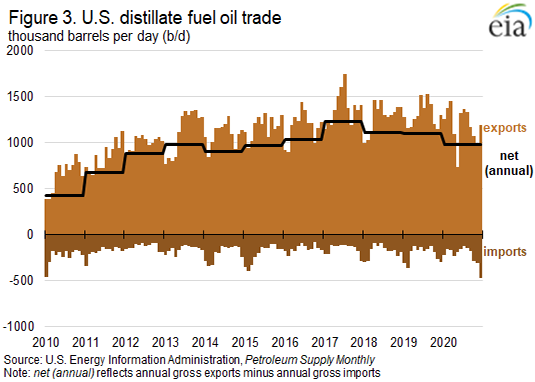
As with gasoline, reduced economic activity and decreased vehicle travel because of responses to the COVID-19 pandemic resulted in less U.S. and global demand for distillate fuel oil. U.S. product supplied of distillate fuel oil decreased to 3.8 million b/d, a reduction of 327,000 b/d compared with the previous year. Exports of distillate decreased in 2020 to 1.2 million b/d, compared with 1.3 million b/d in 2019. Distillate exports vary more in their destinations than gasoline, and in previous years, the United States exported large volumes of distillate fuel oil to Europe, Mexico, and Central and South America. U.S. exports to Europe were most substantially affected in 2020, with distillate exports to Europe lower than their five-year average every month of the year except for February.
Unlike gasoline, imports of distillate fuel oil increased in 2020 to 217,000 b/d, 14,000 b/d more than in 2019 and the highest since 2010. The increased imports were more concentrated in the second half of the year, when they rose higher than the five-year high beginning in September and remained high through the fourth quarter. Despite relatively high regional inventories, the East Coast (Petroleum Administration for Defense District, or PADD, 1) still accounted for a majority of distillate imports of any of the five PADD regions, averaging 92% of total U.S. distillate imports during the fourth quarter of 2020. Product supplied of distillate fuel oil on the East Coast remained near the five-year average during the last three months of 2020, likely reflecting seasonal demand for distillate for home heating oil. The East Coast may also have imported more distillate as a result of reduced domestic refinery production owing to the closure of the Philadelphia Energy Solutions refinery in 2019 and hurricane-induced refinery outages on the U.S. Gulf Coast in the fall of 2020. Increased imports of distillate, combined with decreased exports, resulted in a decrease in net exports of U.S. distillate fuel oil to 983,000 b/d, a reduction of 121,000 b/d compared with 2019 (Figure 3).
Global responses to the COVID-19 pandemic substantially affected kerosene-type jet fuel demand because numerous countries enacted restrictions on international and domestic air travel to limit the spread of the virus. In the United States, the annual average product supplied of jet fuel decreased to 1.1 million b/d in 2020, a reduction of 665,000 b/d compared with 2019. The rapid reduction in demand for the product led to reduced refinery production of jet fuel as many U.S. refiners, particularly along the U.S. Gulf Coast, shifted their product yields away from jet fuel production, which contributed to substantially reduced exports of jet fuel. In 2020, jet fuel exports averaged 95,000 b/d, down from 220,000 b/d in 2019. The decline of jet fuel imports was significantly lower than the decline in exports. In 2020, jet fuel imports averaged 150,000 b/d, down 14,000 b/d compared with 2019. As a result, the United States was a net importer of kerosene-type jet fuel, with net imports of 55,000 b/d, compared with net exports of 56,000 b/d in 2019, which marks the first year since 2010 that the United States was a net jet fuel importer (Figure 4).

U.S. average regular gasoline and diesel prices increase
The U.S. average regular gasoline retail price increased more than 1 cent to $2.87 per gallon on March 22, 75 cents higher than the same time last year. The Rocky Mountain price increased nearly 10 cents to $2.94 per gallon, the West Coast price increased nearly 4 cents to $3.47 per gallon, the East Coast price increased 2 cents to $2.81 per gallon, and the Gulf Coast price increased nearly 2 cents to $2.62 per gallon. The Midwest price decreased more than 2 cents to $2.74 per gallon.
The U.S. average diesel fuel price increased less than 1 cent, remaining virtually unchanged at $3.19 per gallon on March 22, 54 cents higher than a year ago. The Rocky Mountain price increased more than 4 cents to $3.32 per gallon, the West Coast price increased nearly 4 cents to $3.68 per gallon, and the East Coast and Gulf Coast prices each increased less than 1 cent, remaining virtually changed at $3.15 per gallon and $2.99 per gallon, respectively. The Midwest price decreased 2 cents to $3.15 per gallon.
Propane/propylene inventories rise
U.S. propane/propylene stocks increased by 0.2 million barrels last week to 41.3 million barrels as of March 19, 2021, 6.2 million barrels (13.1%) less than the five-year (2016-2020) average inventory levels for this same time of year. Midwest and East Coast inventories increased by 0.6 million barrels and 0.1 million barrels, respectively. Gulf Coast and Rocky Mountain/West Coast inventories decreased by 0.4 million barrels and 0.1 million barrels, respectively.
Residential heating fuel prices decrease
As of March 22, 2021, residential heating oil prices averaged more than $2.88 per gallon, more than 2 cents per gallon lower than last week’s price but more than 43 cents per gallon higher than last year’s price at this time. Wholesale heating oil prices averaged $1.96 per gallon, 14 cents per gallon lower last week’s price but nearly 85 cents per gallon above last year’s price.
Residential propane prices averaged more than $2.32 per gallon, almost 4 cents per gallon lower than last week’s price but more than 42 cents per gallon above last year’s price. Wholesale propane prices averaged nearly $1.04 per gallon, almost 6 cents per gallon below last week’s price but nearly 62 cents per gallon above last year’s price.
For questions about This Week in Petroleum, contact the Petroleum Markets Team at 202-586-4522.
Retail prices (dollars per gallon)

|

|

|

|
| Retail prices | Change from last | ||
|---|---|---|---|
| 03/22/21 | Week | Year | |
| Gasoline | 2.865 | 0.012up | 0.745up |
| Diesel | 3.194 | 0.003up | 0.535up |
| Heating Oil | 2.881 | -0.022down | 0.434up |
| Propane | 2.323 | -0.035down | 0.421up |
Futures prices (dollars per gallon*)

|

|

|
|
| Futures prices | Change from last | ||
|---|---|---|---|
| 03/19/21 | Week | Year | |
| Crude oil | 61.42 | -4.19down | 38.99up |
| Gasoline | 1.943 | -0.207down | 1.338up |
| Heating oil | 1.822 | -0.146down | 0.816up |
| *Note: Crude oil price in dollars per barrel. | |||
Stocks (million barrels)

|

|

|

|
| Stocks | Change from last | ||
|---|---|---|---|
| 03/19/21 | Week | Year | |
| Crude oil | 502.7 | 1.9up | 47.4up |
| Gasoline | 232.3 | 0.2up | -7.0down |
| Distillate | 141.6 | 3.8up | 17.1up |
| Propane | 41.269 | 0.240up | -18.155down |