This Week in Petroleum
Additional pipeline capacity from Canada to the United States could displace some crude oil by rail
On October 1, 2021, the Enbridge Inc. Line 3 replacement pipeline became fully operational, delivering crude oil from Edmonton, Alberta, to Superior, Wisconsin. The pipeline’s start comes seven years after the announcement of the Line 3 replacement project, which was designed to restore the pipeline’s capacity to 760,000 barrels per day (b/d), from about half that amount, and improve its safety. Because the Line 3 replacement project increases the capacity for U.S. crude oil imports by pipeline from Canada, it could displace some crude oil currently shipped by rail. This change could increase Western Canada Select (WCS) crude oil prices and narrow the price spread between WCS and West Texas Intermediate (WTI), which has at times widened significantly as a result of a lack of pipeline capacity. In addition, the expanded capacity could facilitate the expected growth in Canada’s crude oil production through 2022.
Enbridge’s Line 3 originally became operational in 1968 but, due to corrosion, transported decreasing amounts of crude oil over time. The replacement project was proposed in 2014, but litigation over the replacement pipeline’s approval, particularly in Minnesota, delayed its opening. Line 3, which along with Lines 1, 2B, and 4 make up Enbridge’s Mainline, spans 1,097 miles, with the U.S. replacement segment running 13 miles through the northeast corner of North Dakota, 337 miles through Minnesota, and 14 miles through Wisconsin (highlighted line in Figure 1).The Wisconsin and North Dakota portions of the project were completed in 2018 and 2020, respectively.

The new line will increase pipeline import capacity into the U.S. Midwest and through to the Gulf Coast. From Superior, Wisconsin, one possible path of southern flows will be down Enbridge’s Line 6 and Mustang pipelines to Patoka, Illinois, where it can connect to several pipelines (not all pictured), including Marathon’s Capline pipeline when that project is completed, expected in early 2022. The Capline pipeline previously delivered 1.2 million b/d of mostly imported crude oil from St. James, Louisiana, north to Patoka, but has been idled for several years because domestic crude oil has displaced imports of light crude oil to the U.S. Gulf Coast. The pipeline is currently undergoing a reversal that will carry light crude oil produced in the Bakken region and heavy crude oil produced in Canada from Patoka to St. James. Another way to transport crude oil from Canada to the U.S. Gulf Coast is via the Flanagan South and Spearhead pipelines that extend from Pontiac, Illinois, to Cushing, Oklahoma. From Cushing, crude oil can flow to Gulf Coast refiners via several pipelines, including TC Energy’s Marketlink pipeline and the Seaway pipeline.
Importing crude oil by pipeline is less expensive than importing by rail, but producers and shippers sometimes use rail transport because of its destination flexibility. In addition, producers and shippers use rail when pipeline capacity is insufficient. Overall, crude oil imports from Canada have gradually increased over time, and as of 2020 made up more than 60% of total U.S. crude oil imports. Because crude oil imports from Canada had been increasing and pipeline capacity had not been increasing prior to the Line 3 replacement, U.S. imports of crude oil by rail generally increased from 2012 through January 2020 (Figure 2). U.S. crude oil receipts by rail from Canada decreased during the COVID-19 pandemic due to lower production in Canada and reduced demand in the United States. Because the Line 3 replacement is now online, U.S. pipeline imports of crude oil from Canada could partially replace rail imports.

As a result of lower levels of U.S. imports by rail, WCS prices may increase relative to WTI, which would mean a lower WTI–WCS price spread. WCS sells at a price discount to WTI because of differences in crude oil quality, as well as increasing production of WCS and pipeline capacity constraints in Western Canada. So far in 2021, the spread between WTI and WCS has fluctuated between $10 per barrel (b) and $14/b, and with a few exceptions, the spread has historically been higher than $10/b (Figure 3). If a lower portion of crude oil from Canada comes by rail, the WTI-WCS spread might decrease because U.S. buyers have the option to receive more crude oil from Canada via pipeline.

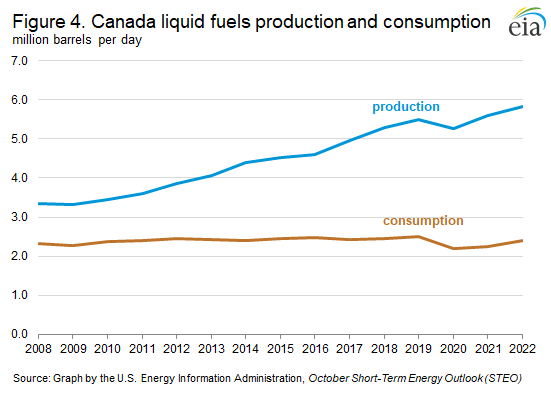
We forecast Canada’s crude oil and other liquids production to continue growing into 2022. Unlike global crude oil and other liquids production, which has been down 6% so far in 2021 compared with 2019, Canada has produced more crude oil so far this year than at the same time in 2019, averaging a record-high 5.6 million b/d of petroleum and other liquid fuels production from January through September. We forecast Canada’s production will increase in 2022 to average 5.8 million b/d (Figure 4). Although Canada’s crude oil production is up 55% from 10 years ago, its crude oil consumption is down 6% over the same period. About 95% of Canada’s crude oil exports go to the United States, and nearly all of the increase in Canada’s crude oil production has been going to the United States and will likely continue to do so until new options become available. One potential future option is the Trans Mountain pipeline expansion, which will increase waterborne export capacity from Canada and may come online by the end of 2022.
U.S. average regular gasoline and diesel prices increase
The U.S. average regular gasoline retail price increased nearly 6 cents to $3.32 per gallon on October 18, $1.17 higher than a year ago. The East Coast price increased more than 6 cents to $3.24 per gallon, the Midwest price increased nearly 6 cents to $3.20 per gallon, the Gulf Coast price increased nearly 5 cents to $2.98 per gallon, the West Coast price increased nearly 5 cents to $4.01 per gallon, and the Rocky Mountain price increased less than 1 cent to $3.57 per gallon.
The U.S. average diesel fuel price increased nearly 9 cents to $3.67 per gallon on October 18, $1.28 higher than a year ago. The West Coast and East Coast prices each increased over 9 cents to $4.23 per gallon and $3.66 per gallon, respectively, the Gulf Coast price increased nearly 9 cents to $3.42 per gallon, the Midwest price increased nearly 8 cents to $3.62 per gallon, and the Rocky Mountain price increased nearly 6 cents to $3.73 per gallon.
Propane/propylene inventories rise
U.S. propane/propylene stocks increased by 1.9 million barrels last week to 73.6 million barrels as of October 15, 2021, 15.4 million barrels (17.3%) less than the five-year (2016-2020) average inventory levels for this same time of year. Gulf Coast, East Coast, and Midwest inventories increased by 1.6 million barrels, 0.2 million barrels, and 0.1 million barrels, respectively, and Rocky Mountain/West Coast inventories increased slightly, remaining virtually unchanged.
Residential heating fuel prices increase
As of October 18, 2021, residential heating oil prices averaged more than $3.36 per gallon, nearly 8 cents per gallon above last week’s price and almost $1.22 per gallon higher than last year’s price at this time. Wholesale heating oil prices averaged more than $2.68 per gallon, more than 8 cents per gallon above last week’s price and almost $1.41 per gallon above last year’s price.
Residential propane prices averaged more than $2.69 per gallon, more than 3 cents per gallon above last week’s price and more than 90 cents per gallon above last year’s price. Wholesale propane prices averaged more than $1.63 per gallon, more than 1 cent per gallon above last week’s price and 94 cents per gallon above last year’s price.
For questions about This Week in Petroleum, contact the Petroleum Markets Team at 202-586-4522.
Retail prices (dollars per gallon)

|

|

|

|
| Retail prices | Change from last | ||
|---|---|---|---|
| 10/18/21 | Week | Year | |
| Gasoline | 3.322 | 0.055up | 1.172up |
| Diesel | 3.671 | 0.085up | 1.283up |
| Heating Oil | 3.363 | 0.079up | 1.216up |
| Propane | 2.691 | 0.034up | 0.901up |
Futures prices (dollars per gallon*)

|

|

|
|
| Futures prices | Change from last | ||
|---|---|---|---|
| 10/15/21 | Week | Year | |
| Crude oil | 82.28 | 2.93up | 41.40up |
| Gasoline | 2.486 | 0.120up | 1.317up |
| Heating oil | 2.574 | 0.100up | 1.395up |
| *Note: Crude oil price in dollars per barrel. | |||
Stocks (million barrels)

|

|

|

|
| Stocks | Change from last | ||
|---|---|---|---|
| 10/15/21 | Week | Year | |
| Crude oil | 426.5 | -0.4down | -61.6down |
| Gasoline | 217.7 | -5.4down | -9.3down |
| Distillate | 125.4 | -3.9down | -35.3down |
| Propane | 73.620 | 1.920up | -24.704down |