Retail gasoline and diesel prices increase significantly following Russia’s further invasion of Ukraine
Retail prices for gasoline and diesel have increased significantly following the start of Russia’s further invasion of Ukraine on February 24. The average U.S. regular retail gasoline price across all formulations (conventional and reformulated) increased 22% from $3.53 per gallon (gal) on February 21 to $4.32/gal on March 14. During the same three-week period, the average U.S. on-highway retail diesel fuel price increased 29% from $4.06/gal to $5.25/gal. Retail gasoline and diesel fuel prices have never increased at a rate that fast over a three-week period in the history of our data (which for gasoline dates back to August 1990 and for diesel dates back to March 1994).
We publish weekly updates to retail gasoline and diesel fuel prices every Monday in our Gasoline and Diesel Fuel Update. The prices we publish are nominal, meaning the data reflect the prices at the pump at the time of the transaction. To compare prices across time periods, a price index such as the Consumer Price Index (CPI) produced by the U.S. Bureau of Labor Statistics is a common tool for adjusting the nominal price level to account for inflation. Adjusting the nominal price to account for inflation is called the real price. The average U.S. regular retail gasoline price for the first two weeks of March 2022 was $4.21/gal. After adjusting historical prices using the CPI, this price in real terms is lower than the all-time high of $5.27/gal in June 2008. The real price adjusts the nominal June 2008 price of $4.05/gal for 14 years of inflation using March 2022 dollars (Figure 1).

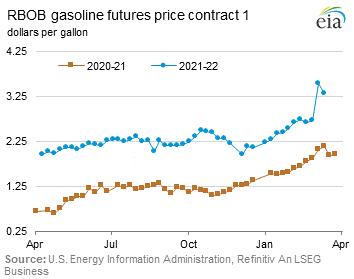
Before the most recent increase, both nominal and real gasoline prices were already at their highest levels in years. After beginning 2021 at a price of $2.25/gal, the average U.S. regular-grade retail gasoline price increased to $3.53/gal on February 21, 2022 (Figure 2). Gasoline prices have increased because gasoline inventories have been below their five-year (2016–2020) average since January 2021 due to low production and increasing demand. In particular, gasoline consumption increased 9% between 2020 and 2021 as a result of rising employment and increased willingness to travel amid declining COVID-19 cases and higher vaccination rates.

Since Russia’s further invasion of Ukraine began on February 24, increases in retail gasoline prices are mostly due to increasing crude oil prices. Crude oil trades on a global market, and crude oil prices make up 56% of the total cost of gasoline as of January 2022. From February 28 to March 7, the average U.S. regular retail gasoline price increased by 14%, making it one of just three week-over-week price increases of more than 10% in our data going back to August 1990. The other two were September 5, 2005, when prices increased by 18% following Hurricane Katrina and September 4, 2017, when prices increased by 12% following Hurricane Harvey (Figure 3). Looking at price changes over a three-week period, the 22% increase from February 21 to March 14 is the largest on record. In California, a market with higher and more variable prices than other states, the average retail gasoline price reached $5.59/gal on March 14, a $1.02/gal (22%) increase from February 21. In real terms, this marks the highest price for California since October 2012.

Retail diesel prices have increased even more than retail gasoline. In the week from February 28 to March 7, the average U.S. on-highway retail diesel fuel price increased 18% as supply risks for both crude oil and distillate markets increased. Russia is a major exporter of distillate fuel to Europe, and the possibility of lower exports from Russia has contributed to significant tightening of the global distillate market. With distillate stocks in the United States already 17% lower than their five-year (2017–2021) average as of March 11, the possibility of further stock draws has added upward pressure to U.S. distillate and diesel prices. In percentage terms, the previous highest week-over-week diesel fuel price increase was 12% on October 3, 2005, according to our data going back to 1994.
However, before Russia’s further invasion of Ukraine, retail diesel prices were already elevated because of low inventories and high demand for distillate fuel, which includes diesel fuel and heating oil. Diesel fuel specifically has been in high demand because of congestion at U.S. ports contributing to increased trucking demand, as shown by increases in the American Trucking Associations’ Truck Tonnage Index. From January 4, 2021, to March 14, 2022, the average U.S. on-highway retail diesel fuel price increased from $2.64/gal to $5.25/gal (Figure 4). Average U.S. on-highway retail diesel prices surpassed $3.00/gal in March 2021 and $3.50/gal in October 2021. On February 14, 2022, retail diesel prices surpassed $4.00/gal.

In California, retail on-highway diesel fuel prices surpassed $5.00/gal on February 21 before increasing to $5.76/gal on March 7 and $6.26/gal on March 14. Retail on-highway diesel fuel prices are averaging more than $5.00/gal in all regions except the Rocky Mountain region, where retail diesel prices averaged $4.97/gal on March 14.
As of March 14, the Brent crude oil price was 16% lower than its recent high on March 8. If oil prices remain at these lower levels, this should lead to lower gasoline and diesel prices.
For questions about This Week in Petroleum, contact the Petroleum and Liquid Fuels Markets Team at 202-586-5840.


