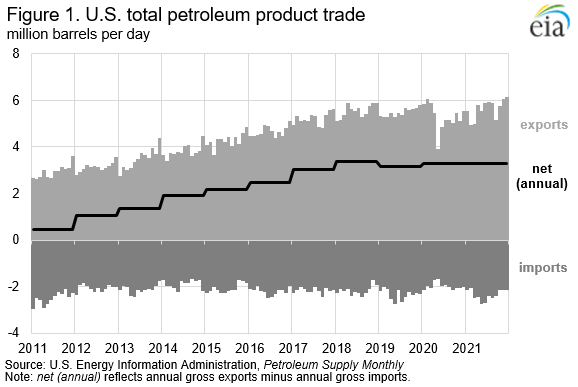
Small reduction in net U.S. petroleum product exports during 2021 driven by distillate and gasoline
U.S. imports of petroleum products increased more than exports of petroleum products in 2021, resulting in a slight reduction in the net exports (exports minus imports) of U.S. petroleum product compared with 2020 (Figure 1). U.S. petroleum product exports averaged 5.7 million barrels per day (b/d) during 2021, an increase of 360,000 b/d compared with 2020. Imports of petroleum products into the United States also increased in 2021 to 2.4 million b/d, which is 371,000 b/d more than in 2020. The increase in both exports and imports represents an expanding U.S. petroleum trade. This expansion is associated with increased economic activity. Demand for petroleum in both the United States and globally after the beginning of the COVID-19 pandemic had decreased substantially in the first half of 2020. Net exports of U.S. petroleum products (exports minus imports) averaged 3.3 million b/d in 2021, which is 10,000 b/d less than in 2020. The petroleum products most exported from the United States by volume during 2021 were propane, distillate fuel oil, and motor gasoline, which collectively accounted for an average of 59% of all petroleum product exports. At the same time, the United States imported large volumes of gasoline and distillate fuel oil into some regions.
The vast majority of U.S. petroleum product exports leave the country from the U.S. Gulf Coast (PADD 3, Figure 2). More than half of all U.S. refining capacity is located in the Gulf Coast, making it the region with the most petroleum products produced. An average of 4.6 million b/d of U.S. petroleum product exports originated from the U.S. Gulf Coast in 2021, an increase of 376,000 b/d compared with 2020, and 0.7 million b/d was imported, an increase of 50,000 b/d compared with 2020. As a result, net U.S. exports out of the region increased to 3.9 million b/d in 2021, up from 3.6 million b/d in 2020. Unlike other regions in the United States, petroleum product imports arriving in the Gulf Coast are not necessarily finished products, and the largest volume of petroleum product imports into the Gulf Coast are unfinished oils. Products categorized as unfinished oils may be heavy fuel oils or diluents intended as refinery inputs that might supplement crude oil inputs to Gulf Coast refineries.

Propane was the most exported single petroleum product by volume from the United States in 2021 for a second consecutive year, after surpassing distillate fuel oil in 2020 (Figure 3). In addition, the United States exported more than 1 million b/d of propane in 2021 for the third consecutive year. U.S. propane exports averaged 1.3 million b/d in 2021, an increase of almost 50,000 b/d from 2020. U.S. exports of propane have increased every year since 2007 because of increased domestic propane production associated with increased upstream crude oil and natural gas production, as well as expanded export capacity along the U.S. Gulf Coast. Most propane exports out of the United States are destined for markets in Asia, and in 2021, Japan, China, South Korea, and Indonesia were among the five top recipients of U.S. propane exports. Of the top-five destinations, the only one outside of Asia was Mexico. U.S. consumption of propane (measured as product supplied) increased by 16,000 b/d in 2021, and imports were relatively low (compared with exports) at 114,000 b/d. Net U.S. propane exports in 2021 averaged 1.2 million b/d.

In 2021, net U.S. exports of distillate fuel oil decreased to 804,000 b/d, their lowest annual average level since 2011. In addition, 2021 marked the second consecutive year in which net distillate exports averaged less than 1 million b/d (Figure 4). The decrease in net exports of distillate resulted from both decreased exports and increased imports compared with 2020. At 1.1 million b/d, U.S. 2021 distillate exports were lower than both 2020 distillate exports (1.2 million b/d) and 2019 distillate exports (1.3 million b/d). U.S. distillate exports were lower in 2021 despite increased global demand compared with 2020. Demand also increased in the United States, averaging 3.9 million b/d, an increase of 150,000 b/d from 2020. Increased U.S. distillate demand may have contributed to reduced distillate exports and almost certainly contributed to increased distillate imports. More than 85% of U.S. distillate imports arrive on the East Coast (PADD 1), where distillate is used as a transportation fuel and a residential home-heating fuel in some regions of the U.S. Northeast. U.S. distillate imports averaged 287,000 b/d in 2021, the highest since 2007. Since the closure of the Philadelphia Energy Solutions (PES) refinery in 2019, the region has replaced some of the lost distillate production from the PES facility with imported volumes and with increased transfers from the U.S. Gulf Coast and Midwest. Even prior to the refinery’s closure, the East Coast was the top distillate-importing region in the United States because of the region’s high demand for products and relatively low petroleum refining capacity.

U.S. distillate exports have historically gone to destinations in Central and South America and in Europe. In 2021, the top-five destinations for U.S. distillate exports were Mexico, Brazil, Chile, Panama, and Peru.
Like distillate, U.S. net exports of motor gasoline decreased in 2021 (Figure 5). Unlike distillate fuel oil, however, U.S. exports of motor gasoline (including both finished motor gasoline and motor gasoline blending components) increased in 2021 as a result of rising global demand and rising U.S. refinery production, compared with the down market in 2020 that resulted from the COVD-19 pandemic. However, rising gasoline demand also contributed to rising imports of the fuel into some regions of the United States, even as exports increased out of other regions. Lost refining capacity in 2020, including the PES closure on the East Coast and a handful of refinery closures and refits on the West Coast, likely contributed to increased gasoline imports in 2021 to account for the lost production. During the summer of 2021, U.S. gasoline exports and imports were both at levels well above their five-year (2016–2020) averages, but lower exports early in 2021 and in the fall and winter seasons contributed to the decrease in net exports on an annual average basis.

For questions about This Week in Petroleum, contact the Petroleum and Liquid Fuels Markets Team at 202-586-5840.


