Tanker rates increase as a result of geopolitical instability and bunker fuel costs
Petroleum product tanker rates for routes originating in Europe rose to record highs in April 2022. Petroleum tankers are generally classified into two groups: “clean” tankers and “dirty” tankers. Clean tankers carry lower-sulfur petroleum products, including refined petroleum products such as motor gasoline, diesel fuel, jet fuel, and naphtha. Dirty tankers mostly carry crude oil, but they can also haul high-sulfur petroleum products such as residual fuel oil. Rates for both clean tankers and dirty tankers are currently rising because of geopolitical instability related to Russia’s full-scale invasion of Ukraine and an increase bunker fuel prices.
Historically, tanker rates increase during periods of low petroleum demand, as onshore storage fills and demand for tankers as a source of flexible, floating storage increases. In April 2020, an oversupply of crude oil and refined products, resulting from decreased demand related to COVID-19 responses, drove clean tanker and dirty tanker rates to record-high levels. Tanker rates decreased after petroleum demand and production cuts increased; tanker rates remained relatively low from September 2020 to September 2021.
Since February 2022, clean tanker rates for ships operating in ports most closely associated with Russia and Europe have increased as a result of geopolitical uncertainty and insurance risk premiums. Clean petroleum products are typically transported on medium-range (MR) tankers, which are generally smaller than dirty tankers. Recently, MR clean tanker rates rose to their highest level since April 2020 (Figure 1). When measured in Worldscale (WS) units, tanker rates for MR vessels on the Baltic-UK Continent (UKC) route increased by 63% from January to April 2022. At the end of April, Rosneft (Russia’s second-largest state-controlled company) announced that it would cut diesel exports to zero from the Baltic port of Primorsk in May. Clean tanker rates on the Baltic-UKC route responded by rising 97% during the first half of May, compared with the month of April.

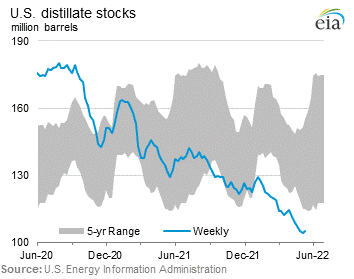
To make up for fewer diesel imports from Russia, Europe is increasing imports from other sources, particularly the United States, according to trade press and ship tracking services. Weekly U.S. U.S. distillate fuel exports to all destinations are near the top of the five-year range (2017–2021) as of early May. Clean tanker rates on the U.S. Gulf Coast (USGC)-UKC route increased by 233% from January to April 2022 as a result of higher demand for vessels carrying clean petroleum products from the United States to Europe. Rates for the Arabian Gulf-Japan and UKC-U.S. Atlantic Coast routes have also increased, by 78% and 59%, respectively, during the same timeframe.
Dirty tanker rates for voyages originating in the Black Sea and Baltic Sea have also increased, by 217% and 447%, respectively, from January to April 2022 (Figure 2) following an insurance risk premium related to Russia’s full-scale invasion of Ukraine as well as higher bunker fuel costs. The high Aframax rates at Russia’s Baltic Sea port, Primorsk, could, in part, be the result of maritime shipping—rather than the Very Large Crude Carriers typically used—to move Russia’s Urals crude oil to China. With fewer available Aframax ships, the dirty tanker rate for the Baltic-UKC route increased from $8.53 per metric ton (mt) in January 2022 to $41.38/mt in April 2022. Sanctions on Russia’s energy and maritime shipping sectors have caused crude oil buyers in Europe to look elsewhere to source their crude oil imports. Weekly U.S. crude oil exports have been above the five-year range since the week of April 15. Meanwhile, tanker rates on routes originating from the Arabian Gulf to Japan and the USGC increased 34% and 53%, respectively, from January to April 2022.

Finally, increased bunker fuel costs affect all tanker rates. Bunker fuel prices for high-sulfur fuel oil (HSFO) and very-low sulfur fuel oil (VLSFO) increased by 51% and 58%, respectively, from December 2021 to March 2022 (Figure 3), but prices of both bunker fuels have since slightly decreased in April 2022. VLSFO is a marine fuel compliant with the International Maritime Organization’s 2020 (IMO2020) sulfur content limit for marine fuel oil. Vessels that have opted to install a scrubber as a retrofit or new build are able to run on cheaper HSFO. A scrubber can cost $2 million to $6 million depending on the vessel or on whether it is a retrofit or new build. The current premium of VLSFO over HSFO increased to a high of $276/mt in March 2022, the highest spread since IMO2020 was implemented in January 2020. The price of bunker fuels is closely correlated with crude oil prices, and the spread between the two fuels reflects the cost of removing sulfur during refining. A combination of high natural gas prices and limited secondary refining conversion capacity contribute to increasing the price spread between VLSFO and HSFO.

For questions about This Week in Petroleum, contact the Petroleum and Liquid Fuels Markets Team at 202-586-5840.


