This Week in Petroleum
Domestic policy and geopolitical developments affected China’s refinery activity and trade in 2022
In 2022, less crude oil was processed by refiners in China than in 2021, marking the first year-over-year decrease in data going back to 2000. Less refinery activity in China resulted from mobility restrictions related to COVID-19 and low petroleum product export quotas. As a result, in 2022, China imported less crude oil in total, but more from Russia and a few other countries.
According to its General Administration of Customs, an average of 13.5 million barrels per day (b/d) of crude oil was processed in China in 2022, a 4% decrease from 2021’s record of 14.0 million b/d (Figure 1). The decrease in crude oil processing in 2022 mostly reflects less refining in the five months from April through August, when China processed an average of only 12.5 million b/d. In July, the least crude oil (11.3 million b/d) was processed in China since January 2018. In 2022, more crude oil was processed by refiners early and, particularly, late in the year, reaching a record monthly high of 15.1 million b/d in September and then averaging 14.1 million b/d from October through December. The amount of crude oil processed ranged between 15.1 million b/d in September and 11.3 million b/d in July, representing the widest difference within any calendar year in monthly data going back to 2011.

Less domestic demand for crude oil reduced refining activities in China in 2022. Demand for petroleum products in China weakened under COVID-19 outbreaks and mobility restrictions in major cities, including Shanghai. These restrictions significantly slowed China’s economic activity, as reflected in its GDP in 2Q22.
Lower product export quotas also contributed to reduced refining activities in China during 2022. China releases several sets of fuel export quotas every year, allocating a set amount of exports to a few, mostly state-owned refiners. China began issuing lower export quotas around the second half of 2021 to address policies and trends that could create potential domestic supply concerns, including:
- A new consumption tax policy announced in June 2021
- Increasing global crude oil prices
- New tax investigations of independent refiners
- The retirement of several small and privately owned refineries in Shandong
These low export quotas, which continued through most of 2022, kept petroleum product exports from China below 1.5 million b/d from July 2021 through August 2022 and subdued refinery demand during that period (Figure 2).
September’s record crude oil processing was likely a response to expectations of new petroleum product export quotas, which China ultimately issued on September 30 to promote economic growth. China’s petroleum product exports also increased sharply in September, perhaps because the expectation of new quotas assured refiners they could use up their old allocations. In addition, industry analysts have suggested that some of the exports counted in September may have actually shipped in October. Following the new export quotas, refinery activity was strong in China during the fourth quarter. The increase in China’s refinery activity at the end of the year was at least partially due to increased exports, which averaged 1.7 million b/d from September through December, up 0.6 million b/d from the first eight months of the year.

Most refining in China uses imported crude oil, so its crude oil imports tend to follow crude oil processing volumes. This was the case in 2022, when crude oil processing volumes and imports into China decreased from 2021 levels. Crude oil imports into China in 2022 were lowest in June and July, when domestic demand for petroleum products was low, crude oil prices were high, and several refineries were undergoing maintenance. In June, China’s crude oil imports decreased to 8.7 million b/d, the least since July 2018, and they remained low at 8.8 million b/d in July (Figure 3). Imports increased following increased refinery demand in response to new product export quotas at the end of the year. In November, 11.4 million b/d of crude oil was imported into China, and 11.3 million b/d imported in December.

In the months following Russia’s full-scale invasion of Ukraine in February 2022, crude oil imports into China from Russia increased. Russia is typically China’s second-largest source of crude oil imports, slightly behind Saudi Arabia. From May through August, when the front-month futures price of Brent crude oil averaged $108 per barrel, a larger share of crude oil imported into China came from Russia. Western economic sanctions have reduced demand for Russia’s crude oil and, as a result, exporters in Russia have discounted crude oil prices and searched for alternative export destinations. Meanwhile, Europe has also been looking for alternative sources of crude oil, driving up prices for Brent crude oil. In response, imports to China have shifted away from more expensive Western sources and toward cheaper crude oil from Russia.
China’s crude oil imports by source country in the second half of 2022, compared with those in the second half of 2021, show how China’s importers changed their crude oil import strategies following Russia’s full-scale invasion of Ukraine. In the second half of 2022, Russia became China’s largest source of crude oil imports at 1.8 million b/d, an increase of 13% from 2021 (Figure 4). Imports into China also increased significantly from the United Arab Emirates and Malaysia, according to China Customs data. Industry analysts indicate that much of the oil that was shipped from Iran to China was relabeled from countries such as Malaysia, the United Arab Emirates, and Oman to escape detection from customs authorities.

Following Russia’s full-scale invasion of Ukraine, crude oil imports into China decreased the most from Angola. Crude oil imports into China from Angola decreased 250,000 b/d (33%) in the second half of 2022 compared with the second half of 2021. According to Kpler trade data, much of the crude oil exported from Angola to China in previous years was diverted to Europe. The relatively high Brent crude oil price associated with Europe’s need to find crude oil imports for the region also likely deterred crude oil imports from North Sea producers in Norway and the United Kingdom. In the second half of 2022, compared with the second half of the previous year, crude oil imports into China decreased by 140,000 b/d (75%) from Norway and 120,000 b/d (88%) from the United Kingdom. Imports from those two countries were even less prior to the G7 price cap that took effect in December. Imports into China also decreased significantly from Oman, importing 140,000 b/d (16%) less in the second half of 2022 than in the second half of 2021.
For questions about This Week in Petroleum, contact the Petroleum and Liquid Fuels Markets Team at 202-586-5840.
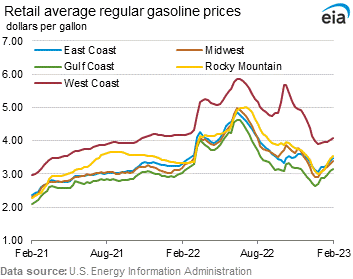
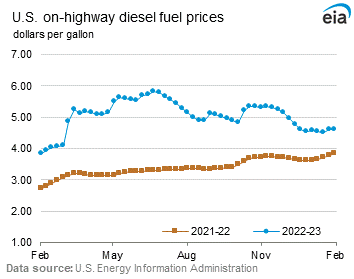
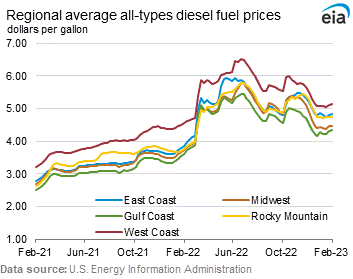
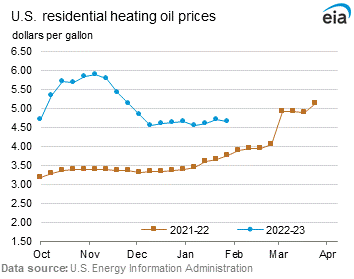
Retail prices (dollars per gallon)

|

|
| Retail prices | Change from last | ||
|---|---|---|---|
| Gasoline | 01/30/23 | Week | Year |
| U.S. | 3.489 | 0.074up | 0.121up |
| East Coast | 3.466 | 0.082up-arrow | 0.153up-arrow |
| Midwest | 3.382 | 0.078up-arrow | 0.196up-arrow |
| Gulf Coast | 3.133 | 0.041up-arrow | 0.104up-arrow |
| Rocky Mountain | 3.544 | 0.110up-arrow | 0.213up-arrow |
| West Coast | 4.085 | 0.077up-arrow | -0.071down-arrow |

|

|
| Retail prices | Change from last | ||
|---|---|---|---|
| Diesel | 01/30/23 | Week | Year |
| U.S. | 4.622 | 0.018up-arrow | 0.776up-arrow |
| East Coast | 4.835 | 0.025up-arrow | 0.983up-arrow |
| Midwest | 4.474 | 0.001up-arrow | 0.760up-arrow |
| Gulf Coast | 4.351 | 0.031up-arrow | 0.743up-arrow |
| Rocky Mountain | 4.742 | 0.006up-arrow | 0.985up-arrow |
| West Coast | 5.126 | 0.031up-arrow | 0.582up-arrow |

|

|
| Retail prices | Change from last | ||
|---|---|---|---|
| 01/30/23 | Week | Year | |
| Heating Oil | 4.657 | -0.044down | 0.881up |
| Propane | 2.713 | 0.008up | -0.062down |
Futures prices (dollars per gallon*)

|

|

|
|
| Futures prices | Change from last | ||
|---|---|---|---|
| 01/27/23 | Week | Year | |
| Crude oil | 79.68 | -1.63down | -7.14down |
| Gasoline | 2.589 | -0.056down | 0.047up |
| Heating oil | 3.266 | -0.201down | 0.480up |
| *Note: Crude oil price in dollars per barrel. | |||
Stocks (million barrels)

|

|

|

|
| Stocks | Change from last | ||
|---|---|---|---|
| 01/27/23 | Week | Year | |
| Crude oil | 452.7 | 4.1up | 37.5up |
| Gasoline | 234.6 | 2.6up | -15.4down |
| Distillate | 117.6 | 2.3up | -5.2down |
| Propane | 73.181 | -2.437down | 23.430up |