Colorado refinery outage is leading to higher gasoline prices in Rocky Mountain region
On December 24, Calgary-based refiner Suncor shut down its 103,000 barrel-per-day (b/d) oil refinery in Commerce City, Colorado. Suncor announced that extreme cold weather earlier in the month had damaged equipment and that the repairs would require a full shutdown of the facility and delay operations until the end of the first quarter of 2023. The refinery outage may complicate the supply of gasoline and diesel in the Denver area and, more broadly, the Rocky Mountain region (PADD 4).
According to the Refinery Capacity Report, the Commerce City refinery is the only refinery currently active in Colorado, one of the largest states in the Rocky Mountains in terms of population and size of its transportation fuel market. In 2021, we estimated the state accounted for 41% of total gasoline sales and 25% of total distillate sales (including both jet fuel and diesel) in the Rocky Mountain region. The Commerce City outage means that the refinery will not be producing fuels to meet this demand locally. Instead, the region will need to draw from existing regional inventories and to transfer petroleum products from other out-of-state refineries (Figure 1).
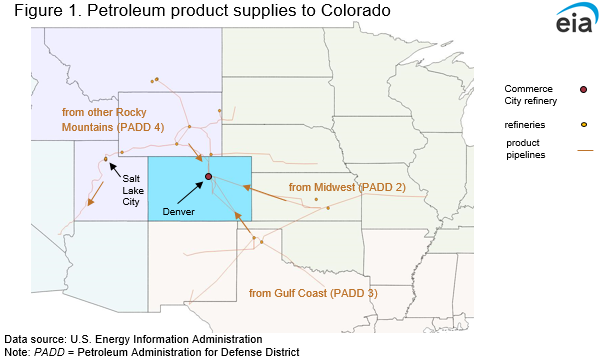
Although parts of the Rocky Mountain region are relatively isolated from major U.S. refining hubs like the Gulf Coast, Colorado has greater pipeline connectivity to other U.S. regions than other states in the Rocky Mountains. So, the transfers from the Midwest and Gulf Coast should partially reduce the need to draw solely from regional inventories. Magellan Midstream and Nustar Energy operate pipelines that have some capacity to bring petroleum products into Colorado and Denver, and the outage is likely to increase utilization along these lines.
The Commerce City outage, in combination with other weather-related refinery disruptions in the Rocky Mountains, contributed to a substantial decrease in regional refinery inputs and utilization rates, according to our Weekly Petroleum Status Report (Figure 2). Refinery inputs reflect the amount of crude oil processed by refineries, while utilization measures total inputs divided by the total refining capacity available. Because the outage is temporary, the Commerce City outage is still counted in the operable capacity side of the utilization calculation, meaning that the Rocky Mountains utilization rate is lower, in part, because of the facility’s repairs. Since the start of 2023, overall Rocky Mountain regional refinery utilization has averaged 71%, 15 percentage points below the five-year (2018–2022) low for this time of year, reflecting the impact of the outage that began in December 2022. Lower refinery utilization reduces production of refined petroleum products such as gasoline and diesel.

In March and April, maintenance at refineries across the country may present additional complications for regional supplies alongside the Commerce City outage. Although lower utilization in the spring is seasonally predictable, we expect this upcoming maintenance season will reduce refinery operations more than normal. Several facilities will also undergo maintenance turnaround projects that were delayed during 2022 when refiners postponed scheduled maintenance to capitalize on high gasoline prices.
Regional inventories of gasoline and diesel fuel started the year well below the five-year average (Figure 3). Low inventories present an additional source of uncertainty for prices in the Rocky Mountains as draws are likely to continue until production at Commerce City resumes. Every week of January, regional gasoline inventories consistently drew down, falling further below the five-year average each week. Inventory data for the week ending February 3 showed an increase in gasoline stocks for the first time since the outage. Regional distillate inventories have also been below average, although weekly changes in inventories have been more mixed. This trend may reflect less-than-normal distillate demand, greater availability of distillate from other refiners, or transfers of the fuel from neighboring regions. Low inventories are likely to contribute to rising regional petroleum product prices. Higher prices may stimulate increased refinery operations in Utah and Wyoming to compensate for the outage and backfill production that would have come from Commerce City. However, scheduled maintenance, outages, or other complications at any of these facilities could reduce production and put continued pressure on regional inventories.

Lower inventory of finished products has already put some pressure on regional prices, and that pressure is likely to increase through the end of the first quarter. From the end of December to February 6, the average U.S. retail gasoline price increased 11%, according to our Gasoline and Diesel Fuel Update, while the average retail price in the Rocky Mountains increased 23%. The larger price increase in the Rocky Mountains is counter to historical movements during the same time of year. Every year since 2018, from the last week of December to the first week of February, the Rocky Mountains retail gasoline price has always increased less (or decreased more) than the U.S. average (Figure 4).

In our weekly Gasoline and Diesel Fuel Update, we publish some city and state retail gasoline prices. Since December 26, both Colorado and Denver prices have increased by more than $1.00 per gallon (gal). The Colorado average price was $3.90/gal, and the Denver average price was $3.86/gal as of February 6 (Figure 5).
In our latest Short-Term Energy Outlook (STEO), we estimate the retail price for gasoline in the Rocky Mountain region will remain elevated in February, averaging $3.58/gal as low inventories continue in the region. We forecast that the Rocky Mountain regional average gasoline price will increase to $3.62/gal in March. Prices are normally lower during the first quarter before rising in the spring and peaking during the summer driving season. As a result, we expect prices to increase in April as well, to reflect normal seasonal demand patterns, even though we expect the refinery to have come back online by that time, in line with Suncor’s announced expectations.
For questions about This Week in Petroleum, contact the Petroleum and Liquid Fuels Markets Team at 202-586-5840.


