This Week in Petroleum
Diesel prices in Europe may be volatile as markets adjust to import ban
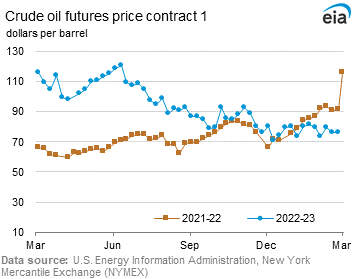
Following Russia’s full-scale invasion of Ukraine in February 2022, the EU began passing a series of sanctions against Russia. On June 3, 2022, the EU adopted a sixth package of sanctions, which banned imports of Russia’s seaborne crude oil into the EU (effective December 5, 2022) and banned seaborne imports of Russia’s petroleum products, including diesel fuel (effective February 5, 2023). The ban on petroleum product imports into the EU from Russia shifted international diesel trade. To increase inventories prior to the sanctions, imports into Europe rose, driven by increased imports from countries in the Middle East and Asia. Rising crude oil prices and globally tight distillate markets increased diesel prices in Northern Europe for most of January 2023. Warm weather, falling natural gas prices, and economic concerns, however, have generally reduced diesel prices in Northwest Europe since January 23. Nonetheless, Europe’s need to import diesel fuel and other petroleum products from farther distances may lead to future price volatility.
Gasoil stocks (which include diesel fuel and heating oil) in the major refining and petroleum trading centers of Northern Europe (Amsterdam and Rotterdam in the Netherlands and Antwerp in Belgium—collectively known as the ARA) have increased significantly during the past few months. From December 1, 2022, to February 23, 2023, ARA gasoil stocks increased 50% (6.1 million barrels). ARA gasoil stocks reached 19.3 million barrels on February 23, 1.5 million barrels more than the previous five-year (2018–2022) average for that week (Figure 1).

One of the drivers of growing diesel stocks in Europe is increased diesel imports. For the 12 months ending September 2022, seaborne diesel imports into Northwest Europe averaged 733,000 barrels per day (b/d), according to Vortexa Analytics. In an effort to increase supplies prior to the ban, market participants increased diesel imports into Europe, beginning around October 2022. From October 2022 to February 2023, imports of diesel into Northwest Europe averaged 951,000 b/d, up 30% compared with the 12-month average ending in September 2022.
Diesel imports from Russia typically make up a significant portion of Northern Europe’s total diesel imports. Although imports from Russia have declined, imports from other areas, notably the Middle East and Asia, have increased (Figure 2). Data from Vortexa Analytics indicate that seaborne imports of diesel from Russia, which made up 53% of all Northwest Europe seaborne imports of diesel from October 2021 through September 2022, fell to 32% from October 2022 through February 2023, dropping to 2% in February, as Russia’s volumes fell and volumes from other countries increased. Data from Vortexa Analytics indicate that imports of diesel from Russia into Northwest Europe fell from an average of 389,000 b/d between October 2021 and September 2022 to 18,000 b/d in February 2023, when Europe’s import ban was implemented.

Imports from destinations in the Middle East and Asia increased to make up for the lost barrels from Russia. The largest increases volumetrically came from Saudi Arabia, increasing from an average of 68,000 b/d from October 2021 through September 2022 to 202,000 b/d in February 2023 (Figure 3). Compared with the same periods, imports from India increased by 110,000 b/d. Imports from China and South Korea, which have not been consistent exporters of diesel to Europe, have likewise increased. Imports from China reached 119,000 b/d in February, and imports from South Korea reached 45,000 b/d.

Although diesel imports from the United States into Northwest Europe fell from January to February, imports from the United States over the past few months have been relatively high. From October 2021 through September 2022, diesel imports from the United States averaged 43,000 b/d. Imports from the United States increased to 107,000 b/d from October 2022 through February 2023.
In addition to the high levels of diesel supply over the past several months, demand side dynamics are pushing down diesel prices. Warm weather in Europe has reduced heating demand this winter, which has decreased residential and electric power natural gas consumption. Electric power generators in some parts of Europe can switch from natural gas to diesel to minimize fuel costs if natural gas prices are relatively high. The low heating demand and recently declining natural gas prices have likely limited any fuel switching, resulting in less diesel consumption than may have occurred with colder weather.
In addition to warm weather, uncertainty regarding Europe’s economic growth is likely limiting some demand expectations. The International Monetary Fund’s World Economic Outlook (WEO), released in January 2023, indicates that European manufacturing and service sectors may be contracting. In addition, the WEO states that consumer confidence and business sentiment have declined, inflation has remained high, and rate increases by the Bank of England and European Central Bank have tightened financial conditions.
These supply and demand developments have put downward pressure on prices of ultra-low sulfur diesel (ULSD) in Northwest Europe (Figure 4). Diesel prices fell from $3.29 per gallon (gal) on January 23, 2023, to $2.65/gal on February 27, 2023, which is less than the price on February 23, 2022 (the day prior to Russia’s full-scale invasion of Ukraine). Over the same period, the price premium of ULSD in ARA compared with Brent crude oil fell from $51.00 per barrel (b) to $29.00/b, indicating the premium that traders are willing to pay has declined.

The recent price declines for Northwest Europe diesel have also reduced the price premium between Northwest Europe diesel and prices in Singapore. According to price data from Bloomberg, the spread between Northwest Europe ULSD and Singapore diesel (500 parts per million sulfur) fell from 70 cents/gal on October 31, 2022, to 16 cents/gal on February 28, 2023. The lower price spread may indicate worsening economics for shipping diesel fuel from Asia to Europe.
Although the Northwest Europe diesel price has declined, Europe’s loss of a significant source of diesel fuel from Russia means it will need to import from more distant regions. As a result, a number of factors could increase price volatility as the markets digest the full impacts of the import ban. If Europe draws down its gasoil stocks, diesel prices in Europe would likely increase to cover the costs of lengthy shipping routes. According to Vortexa Analytics, a long-range 2 tanker (LR2) leaving from India’s west coast will take approximately 20 days to reach ARA, assuming a laden speed of 13 knots. For comparison, a voyage from Russia’s port of Ust-Luga takes about four days to reach ARA. Although ARA diesel stocks have increased and prices have fallen, global diesel markets may be volatile until the market fully adjusts to the new dynamics.
For questions about This Week in Petroleum, contact the Petroleum and Liquid Fuels Markets Team at 202-586-5840.
Retail prices (dollars per gallon)

|

|
| Retail prices | Change from last | ||
|---|---|---|---|
| Gasoline | 02/27/23 | Week | Year |
| U.S. | 3.342 | -0.037down | -0.266down |
| East Coast | 3.244 | -0.047down-arrow | -0.319down-arrow |
| Midwest | 3.170 | -0.050down-arrow | -0.296down-arrow |
| Gulf Coast | 2.912 | -0.095down-arrow | -0.395down-arrow |
| Rocky Mountain | 3.782 | -0.044down-arrow | 0.410up-arrow |
| West Coast | 4.250 | 0.061up-arrow | -0.061down-arrow |

|

|
| Retail prices | Change from last | ||
|---|---|---|---|
| Diesel | 02/27/23 | Week | Year |
| U.S. | 4.294 | -0.082down-arrow | 0.190up-arrow |
| East Coast | 4.446 | -0.126down-arrow | 0.285up-arrow |
| Midwest | 4.120 | -0.074down-arrow | 0.152up-arrow |
| Gulf Coast | 4.027 | -0.073down-arrow | 0.155up-arrow |
| Rocky Mountain | 4.559 | -0.062down-arrow | 0.583up-arrow |
| West Coast | 4.933 | -0.039down-arrow | 0.222up-arrow |

|

|
| Retail prices | Change from last | ||
|---|---|---|---|
| 02/27/23 | Week | Year | |
| Heating Oil | 4.231 | -0.032down | 0.177up |
| Propane | 2.698 | -0.004down | -0.189down |
Futures prices (dollars per gallon*)

|

|

|
|
| Futures prices | Change from last | ||
|---|---|---|---|
| 02/24/23 | Week | Year | |
| Crude oil | 76.32 | -0.02down | -15.27down |
| Gasoline | 2.359 | -0.049down | -0.368down |
| Heating oil | 2.796 | 0.084up | -0.054down |
| *Note: Crude oil price in dollars per barrel. | |||
Stocks (million barrels)

|

|

|

|
| Stocks | Change from last | ||
|---|---|---|---|
| 02/24/23 | Week | Year | |
| Crude oil | 480.2 | 1.2up | 66.8up |
| Gasoline | 239.2 | -0.9down | -6.8down |
| Distillate | 122.1 | 0.2up | 3.0up |
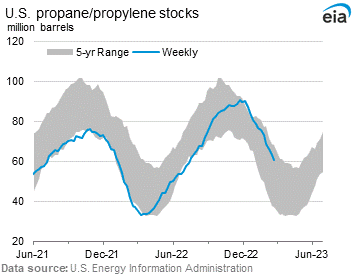
| Propane | 60.590 | -2.746down | 23.436up |