This Week in Petroleum
Beaumont refinery expansion boosts Gulf Coast refining capacity
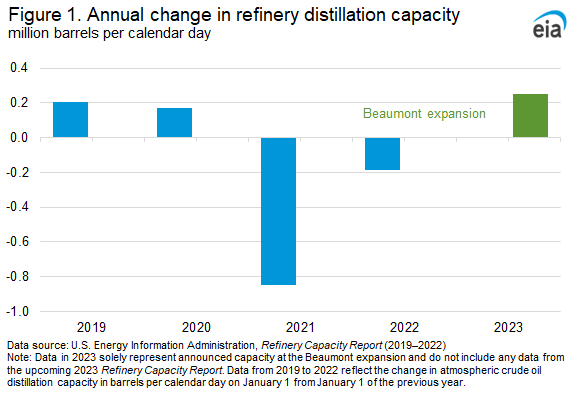
On March 16, ExxonMobil announced the beginning of operations at its Beaumont refinery expansion, adding 250,000 barrels per day (b/d) of capacity according to the company’s announcement, and making the refinery one of the largest oil refineries in the United States (measured by crude oil distillation capacity). According to ExxonMobil, the total capacity of the Beaumont facility is now 630,000 b/d.
The Beaumont expansion is the first major refinery capacity expansion to come online since the COVID-19 pandemic, which led to several refinery capacity closures over the course of 2020 and 2021 (Figure 1). Total U.S. refinery distillation capacity decreased from 19.0 million b/d at the start of 2020 to 17.9 million b/d at the start of 2022.
Increased U.S. Gulf Coast refinery capacity should grow gross refinery inputs and production of refined products such as gasoline and distillate fuel oil (usually sold as diesel). Since mid-March, total crude oil inputs at refineries on the U.S. Gulf Coast, have increased, as reported in our Weekly Petroleum Status Report (WPSR), reflecting the increased capacity at the Beaumont refinery. During the same time, the WPSR does not show a corresponding increase in operable capacity because, unlike the refinery input data, which are collected from weekly surveys, weekly capacity data are carried forward from the most recent Petroleum Supply Monthly (PSM), with data currently for January 2023. Weekly utilization numbers also use the capacity number from the PSM, which means that our reported U.S. Gulf Coast refinery utilization may increase to abnormally high levels until the March data are published in the May PSM. Because the capacity was not online on January 1, the expansion will also not be reported in the upcoming Refinery Capacity Report later this year.
Beaumont is the largest piece of a cluster of new capacity coming online over 2023 and 2024 concentrated on the U.S. Gulf Coast. The region has historically been the largest refining hub in the United States and accounts for 8 of the 10 largest refineries in the country. New refinery capacity in the region capitalizes on growing U.S. crude oil production and benefits from existing infrastructure for shipping refined products to the East Coast. The region also benefits from export infrastructure to Mexico (the largest destination for U.S. gasoline exports) and to other destinations via the availability of coastal tanker loading facilities.
Following capacity closures over the last three years, the Beaumont refinery expansion reflects an increasing concentration of U.S. refinery capacity on the Gulf Coast. From the January 1, 2019, to January 1, 2022, the U.S. Gulf Coast lost 269,000 b/d (3%) of capacity (Figure 2). This drop comprises just under a third of total U.S. refinery capacity that was lost over the same period. It was more than the West Coast, which lost 216,000 b/d of capacity, but less than the East Coast, which lost 406,000 b/d of capacity. At 250,000 b/d, the Beaumont expansion replaces most of the capacity that has been decommissioned since 2019. An expansion of coking capacity at Valero’s Port Arthur refinery and a distillation capacity expansion at Marathon Petroleum’s Galveston Bay refinery are also scheduled to come online this year, although they will be partially offset by the announced closure of LyondellBasell’s Houston refinery at the end of 2023. Outside of the U.S. Gulf Coast, a previously decommissioned 60,000 b/d distillation unit was reactivated at PBF Energy’s Paulsboro, New Jersey, refinery in September 2022, marking another recent expansion in refinery capacity.

Increased refinery capacity and associated higher gasoline and diesel production should put downward pressure on fuel prices this summer compared with 2022. At the same time, more refinery production may be counteracted at least in part by the effects of higher crude oil prices, increasing consumption, and low inventories. Crack spreads are a method of looking at fuel prices minus the cost of crude oil and serve as an indicator of refinery profitability (Figure 3). So far in 2023, the U.S. Gulf Coast regional crack spread (calculated against Light Louisiana Sweet crude oil) increased from $0.45 per gallon (gal) for gasoline to $0.75/gal since the start of the year, in line with typical seasonal increases heading into the summer. The diesel crack spread decreased from $1.20/gal in January to $0.54/gal as of April 17.

Global refinery capacity, like in the United States, also decreased during 2020 and 2021, which drew on global inventories and increased calls on U.S. exports to meet consumption needs in other markets. Other international refinery capacity additions have been coming online or are expected to come online later this year as well, particularly in the Middle East, Nigeria, India, and China. These expansions will likely increase global supply of refined products and put additional downward pressure on crack spreads.
For questions about This Week in Petroleum, contact the Petroleum and Liquid Fuels Markets Team at 202-586-5840.
Retail prices (dollars per gallon)
|

|
| Retail prices | Change from last | ||
|---|---|---|---|
| Gasoline | 04/17/23 | Week | Year |
| U.S. | 3.663 | 0.067up | -0.403down |
| East Coast | 3.512 | 0.051up-arrow | -0.414down-arrow |
| Midwest | 3.590 | 0.074up-arrow | -0.286down-arrow |
| Gulf Coast | 3.341 | 0.088up-arrow | -0.392down-arrow |
| Rocky Mountain | 3.524 | 0.086up-arrow | -0.624down-arrow |
| West Coast | 4.525 | 0.068up-arrow | -0.570down-arrow |

|

|
| Retail prices | Change from last | ||
|---|---|---|---|
| Diesel | 04/17/23 | Week | Year |
| U.S. | 4.116 | 0.018up-arrow | -0.985down-arrow |
| East Coast | 4.198 | -0.001down-arrow | -0.953down-arrow |
| Midwest | 4.027 | 0.059up-arrow | -0.894down-arrow |
| Gulf Coast | 3.876 | -0.007down-arrow | -0.979down-arrow |
| Rocky Mountain | 4.104 | 0.009up-arrow | -0.990down-arrow |
| West Coast | 4.692 | -0.007down-arrow | -1.103down-arrow |
Futures prices (dollars per gallon*)

|

|

|
|
| Futures prices | Change from last | ||
|---|---|---|---|
| 04/14/23 | Week | Year | |
| Crude oil | 82.52 | NAno_change | NAno_change |
| Gasoline | 2.836 | NAno_change | NAno_change |
| Heating oil | 2.639 | NAno_change | NAno_change |
| *Note: Crude oil price in dollars per barrel.
Markets were closed on 4/15/2022 and 4/7/2023. |
|||
Stocks (million barrels)

|

|
|

|
| Stocks | Change from last | ||
|---|---|---|---|
| 04/14/23 | Week | Year | |
| Crude oil | 466.0 | -4.6down | 52.2up |
| Gasoline | 223.5 | 1.3up | -8.8down |
| Distillate | 112.1 | -0.4down | 3.4up |
| Propane | 55.456 | -0.721down | 18.466up |