This Week in Petroleum
Notice: Changes to August 31, 2023 Release of Petroleum Supply Monthly and Petroleum Supply Annual
We will add new data labeled Transfers to crude oil supply to national and regional volumetric balance tables for petroleum and biofuels beginning with data that will be released on August 31, 2023. Transfers to crude oil supply will include barrels of unfinished oils (refinery feedstocks) and natural gas liquids that we identified as being added to crude oil supply by blending. We will make changes to account for these transfers in the Weekly Petroleum Status Report before the end of the year.
U.S. gasoline prices are on the rise heading into Labor Day
Ahead of this Labor Day, Hurricane Idalia is impacting U.S. Gulf Coast production and pipeline facilities. Hurricane-induced facility closures can have uncertain effects on the retail price of gasoline, and the scale of the impact relates to the duration and severity of the closures.
On August 28, 2023, the Monday before Labor Day weekend, the regular gasoline retail price averaged $3.81 per gallon (gal) across the United States, effectively the same price as last year (Figure 1). After adjusting for inflation (real terms), retail gasoline prices were 4%, or 14 cents/gal, lower than last year. Over the past five weeks, a combination of crude oil production cuts by Saudi Arabia, low U.S. gasoline inventories, and announced refinery maintenance in the Northeast have increased the regular gasoline retail price by 6% (22 cents/gal). Prices have generally increased from the start of this year, following typical seasonal trends, and have shown less volatility than last year. The Labor Day weekend marks the unofficial end to the summer driving season, when gasoline demand is usually at its highest in the United States.

We estimate that world oil consumption this summer has returned to summer 2019 levels. When combined with production cuts from Saudi Arabia and other OPEC+ members, these two factors are putting upward pressure on crude oil prices (the largest component of the cost to produce gasoline). In early June, Saudi Arabia announced a new voluntary oil production cut of 1.0 million barrels per day (b/d) for July and August 2023. On August 4, Saudi Arabia extended the production cut into September. These cuts helped increase the Brent crude oil price by 13% ($10.01 per barrel [b]) to $84.98/b in August compared with June, before the voluntary production cut took effect (Figure 2). Earlier production cuts by OPEC+ members in April had a limited impact on crude oil prices because concerns about slowing economic growth weighed on the outlook for crude oil demand. More recent data show improving economic conditions in the United States, supporting expectations of higher global demand. We expect the production cuts, combined with increasing demand, will cause global oil inventories to fall and put upward pressure on crude oil prices through the end of this year.

Flat gasoline production has kept U.S. gasoline inventories low and, in combination with growing demand, has contributed to higher gasoline prices. U.S. gasoline inventories have been below the previous five-year average since March 2022 (Figure 3). Record gasoline exports and constraints on refiner capacity reduced inventories in 2022, and refinery outages kept inventories below last year’s levels for much of 2023. Refinery output remained subdued earlier in the year due to increased refinery maintenance that was originally scheduled for spring and fall of 2022. More recently, unplanned outages continue to hamper gasoline inventory builds. Among the outages, a reformer outage occurred at Marathon’s Galveston Bay refinery, and fluid catalytic cracking unit outages occurred at Phillips 66’s Bayway refinery and ExxonMobil’s Baton Rouge refinery. Many of the outages affected secondary conversion units, reducing the relative yields of gasoline from those facilities.

Refinery outages and capacity constraints are making refining account for a larger share of the overall cost of gasoline than in the past. According to our Gasoline and Diesel Fuel Update, as of July 2023, refining (the difference between refiners’ crude oil acquisition costs and wholesale gasoline prices) accounted for an average of 22% of the overall gasoline retail price for the first seven months of 2023 compared with the five-year (2018–22) average of 15% (Figure 4). This change means that even though crude oil prices have declined from last year’s high, retail gasoline prices have remained higher than they historically would because of increased costs for refining. We expect recently announced maintenance for Irving Oil’s 320,000-b/d refinery in Saint John, New Brunswick, and Monroe Energy’s 185,000-b/d refinery in Trainer, Pennsylvania will keep refining costs high over the coming months. Maintenance on these refineries is planned to run from mid-September to mid-November.

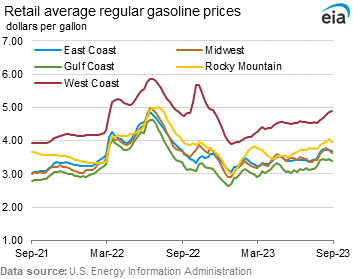
U.S. gasoline prices vary regionally, reflecting local supply and demand conditions, different fuel specifications required by state laws, and taxes (Figure 5). Regional gasoline prices are usually highest on the West Coast due to the region’s limited connections with other major refining centers (including the Gulf Coast), tight local supply and demand conditions, and required gasoline specifications that make it more costly to manufacture. West Coast prices as of August 28 were $4.88/gal, 2% (10 cents/gal) higher than the same time last year. The Rocky Mountain region faces similar logistical constraints as the West Coast, although overall supply and demand in the region are both lower. Rocky Mountain gasoline retail prices averaged $3.98/gal, down 1% (4 cents/gal) from 2022.

The Gulf Coast, which accounted for 54% of the country’s total refining capacity as of January 2023, produces more gasoline than it consumes. As a result, the gasoline price on the Gulf Coast is often the lowest in the United States. On August 28, the average retail gasoline price for the Gulf Coast was $3.38/gal, up 1% (2 cents/gal) from the same time last year.
On the East Coast, the largest gasoline demand market of the five regions, retail gasoline prices were $3.64/gal on August 28, down 1% (4 cents) from 2022. Midwest prices decreased to $3.68/gal, 1% (4 cents) lower than this time in 2022.
For questions about This Week in Petroleum, contact the Petroleum and Liquid Fuels Markets Team at 202-586-5840.
Retail prices (dollars per gallon)

|

|
| Retail prices | Change from last | ||
|---|---|---|---|
| Gasoline | 08/28/23 | Week | Year |
| U.S. | 3.813 | -0.055down | -0.014down |
| East Coast | 3.678 | -0.050down-arrow | -0.044down-arrow |
| Midwest | 3.637 | -0.083down-arrow | -0.038down-arrow |
| Gulf Coast | 3.378 | -0.080down-arrow | 0.022up-arrow |
| Rocky Mountain | 3.975 | -0.064down-arrow | -0.045down-arrow |
| West Coast | 4.880 | 0.014up-arrow | 0.097up-arrow |

|

|
| Retail prices | Change from last | ||
|---|---|---|---|
| Diesel | 08/28/23 | Week | Year |
| U.S. | 4.475 | 0.086up-arrow | -0.640down-arrow |
| East Coast | 4.475 | 0.053up-arrow | -0.591down-arrow |
| Midwest | 4.385 | 0.083up-arrow | -0.787down-arrow |
| Gulf Coast | 4.169 | 0.074up-arrow | -0.652down-arrow |
| Rocky Mountain | 4.658 | 0.158up-arrow | -0.314down-arrow |
| West Coast | 5.302 | 0.162up-arrow | -0.417down-arrow |
Futures prices (dollars per gallon*)

|

|

|
|
| Futures prices | Change from last | ||
|---|---|---|---|
| 08/25/23 | Week | Year | |
| Crude oil | 79.83 | -1.42down | -13.23down |
| Gasoline | 2.876 | 0.053up | 0.025up |
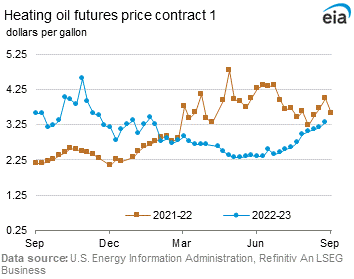
| Heating oil | 3.308 | 0.148up | -0.700down |
| *Note: Crude oil price in dollars per barrel. | |||
Stocks (million barrels)

|

|

|

|
| Stocks | Change from last | ||
|---|---|---|---|
| 08/25/23 | Week | Year | |
| Crude oil | 422.9 | -10.6down | 4.6up |
| Gasoline | 217.4 | -0.2down | 2.9up |
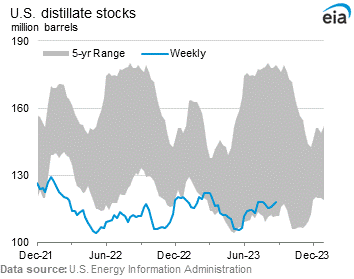
| Distillate | 117.9 | 1.2up | 6.2up |
| Propane | 95.465 | 3.179up | 23.235up |