This Week in Petroleum
Notice: Changes to August 31, 2023 Release of Petroleum Supply Monthly and Petroleum Supply Annual
We added new data labeled Transfers to crude oil supply to national and regional volumetric balance tables for petroleum and biofuels beginning with data released on August 31, 2023. Transfers to crude oil supply include barrels of unfinished oils (refinery feedstocks) and natural gas liquids that we identified as being added to crude oil supply by blending. We will make changes to account for these transfers in the Weekly Petroleum Status Report before the end of the year.
Global gasoline crack spreads fall amid lower U.S. demand and the switch to winter-grade fuel
Low gasoline demand and the switch to winter-grade gasoline pushed the spread between gasoline blendstock and crude oil prices to multiyear lows in early October 2023.
The New York Harbor RBOB-Brent crack spread measures the difference in price between the petroleum component of gasoline used in many parts of the United States and the price of Brent crude oil. This measure serves as an indicator of gasoline market supply and demand conditions.
After reaching a summer high of 94 cents per gallon (gal) on July 27, the RBOB-Brent crack spread decreased in August, ending the month at 70 cents/gal (Figure 1). The crack spread subsequently fell by 53 cents/gal in September, ending the month at 17 cents/gal. So far in October, the crack spread has averaged 16 cents/gal, and if it remains about the same through the end of the month, it would be the lowest monthly average since December 2020.

One reason gasoline crack spreads have decreased recently is that U.S. gasoline inventories have increased as U.S. gasoline demand has declined. As of October 13, U.S. gasoline inventories were at 223.3 million barrels, an 8.6-million-barrel increase (4%) from 214.7 million barrels on September 1 (Figure 2). In each of the previous five years (2018–2022), U.S. gasoline inventories decreased during the same six-week period from the first week of September through the second week of October, averaging a draw of 4.6 million barrels.

U.S. gasoline inventories have been growing faster than usual because of low gasoline demand and relatively high refinery runs. Based on weekly estimates in our Weekly Petroleum Status Report (WPSR), U.S. gasoline consumption, measured as product supplied, has been below the low levels seen both in 2022, when demand was down after months of high summer gasoline prices and inflation, and in 2020, when responses to the COVID-19 pandemic reduced demand (Figure 3). As of October 13, the four-week rolling average for gasoline consumption was 8.5 million barrels per day (b/d), 5% less than the five-year average and 8% below 2019 pre-COVID consumption. Some factors that may be contributing to lower gasoline demand than in previous years include higher gasoline prices, reduced discretionary spending due to persistently high inflation, and improved fuel efficiency of vehicles. Our WPSR estimates suggest that U.S. refinery runs this year were above average in September and have been near average in October.

Another reason gasoline crack spreads have decreased significantly is the switch to winter-grade gasoline. Motor gasoline is a combination of different components—such as reformate, alkylate, and aromatics—that can be produced from different petroleum refining processes. Different proportions of each component are used to meet varying product specifications by season and region, including formulations to reduce pollutants (such as sulfur and benzene) and specifications related to the fuel’s volatility (rate of evaporation) and octane rating. Because evaporative emissions are lower in cooler weather, octane specifications for winter-grade gasoline can be met using less expensive and more volatile blending components, such as butane.
This year, the switch to blending butane and other winter-grade components reduced refiners’ costs more than usual because summer-grade blending components were more expensive this summer . These elevated costs were partially responsible for this summer’s high gasoline prices, and therefore, the shift away from those blending components in September contributed to a sharper decline in gasoline production costs.
Although less significant than the price effects of low gasoline demand and the switch to winter-grade gasoline, lower renewable identification number (RIN) prices have contributed slightly to the decreasing gasoline crack spread as well. RIN values—the compliance mechanism used for the Renewable Fuel Standard (RFS) program administered by the U.S. Environmental Protection Agency—were relatively high until recently. From September 1 to October 17, the ethanol RIN value fell 49 cents from $1.40 to $0.91. Because each RIN represents 1 gallon of ethanol and an average gallon of gasoline contains about 10% ethanol, up to about 5 cents/gal of the recent RBOB price decline can be attributed to RIN prices.
Although the recent inventory build, fuel specification change, and decrease in RIN price most directly affected U.S. RBOB prices, motor gasoline is part of a global market, and changes in U.S. market fundamentals can affect prices at other major hubs. In addition, falling gasoline crack spreads in other trading hubs suggest local market conditions—such as falling demand—could be developing in world markets.
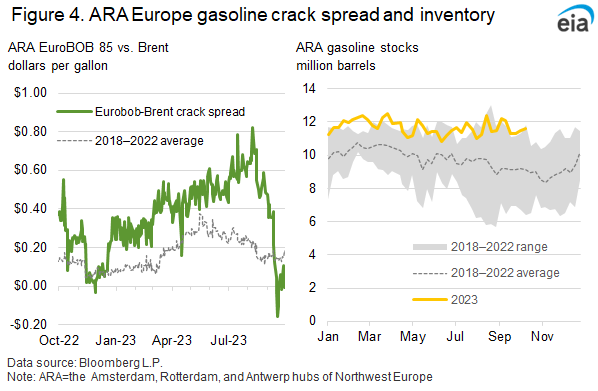
In the Amsterdam, Rotterdam, and Antwerp (ARA) hubs of Northwest Europe, gasoline crack spreads fell from a high of 82 cents/gal on August 25 to as low as -16 cents/gal on October 4 (Figure 4). Despite ARA gasoline inventories hovering around five-year highs in 2023, the EuroBOB-Brent crack spread had been high all year, generally following U.S. crack spreads.
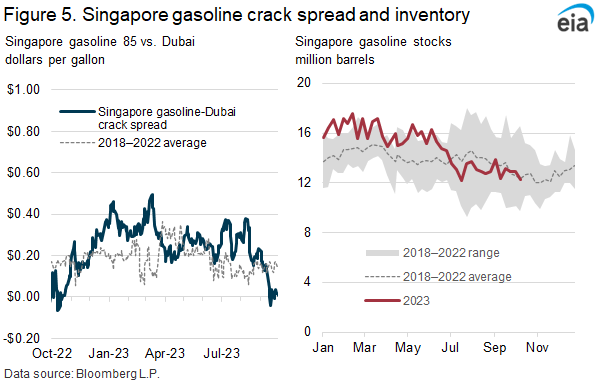
The gasoline crack spread also fell significantly in September at Asia’s major pricing hub in Singapore. The Singapore gasoline crack spread relative to Dubai crude oil fell from 38 cents/gal on August 25 to a low of -4 cents/gal on October 4, despite little movement in gasoline inventories during that period (Figure 5).
For questions about This Week in Petroleum, contact the Petroleum and Liquid Fuels Markets Team at 202-586-5840.
Retail prices (dollars per gallon)
|

|
| Retail prices | Change from last | ||
|---|---|---|---|
| Gasoline | 10/16/23 | Week | Year |
| U.S. | 3.576 | -0.108down | -0.295down |
| East Coast | 3.396 | -0.080down-arrow | -0.128down-arrow |
| Midwest | 3.326 | -0.096down-arrow | -0.462down-arrow |
| Gulf Coast | 3.040 | -0.145down-arrow | -0.279down-arrow |
| Rocky Mountain | 3.705 | -0.115down-arrow | -0.212down-arrow |
| West Coast | 4.997 | -0.170down-arrow | -0.445down-arrow |

|
|
| Retail prices | Change from last | ||
|---|---|---|---|
| Diesel | 10/16/23 | Week | Year |
| U.S. | 4.444 | -0.054down-arrow | -0.895down-arrow |
| East Coast | 4.404 | -0.054down-arrow | -0.946down-arrow |
| Midwest | 4.304 | -0.072down-arrow | -1.042down-arrow |
| Gulf Coast | 4.114 | -0.025down-arrow | -0.904down-arrow |
| Rocky Mountain | 4.664 | -0.053down-arrow | -0.604down-arrow |
| West Coast | 5.528 | -0.072down-arrow | -0.469down-arrow |
|

|
| Retail prices | Change from last | ||
|---|---|---|---|
| 10/16/23 | Week | Year | |
| Heating Oil | 4.510 | 0.189up | -1.212down |
| Propane | 2.393 | 0.003up | -0.271down |
Futures prices (dollars per gallon*)

|

|

|
|
| Futures prices | Change from last | ||
|---|---|---|---|
| 10/13/23 | Week | Year | |
| Crude oil | 87.69 | 4.90up | 2.08up |
| Gasoline | 2.265 | 0.073up | -0.366down |
| Heating oil | 3.212 | 0.311up | -0.768down |
| *Note: Crude oil price in dollars per barrel. | |||
Stocks (million barrels)

|

|

|
|
| Stocks | Change from last | ||
|---|---|---|---|
| 10/13/23 | Week | Year | |
| Crude oil | 419.7 | -4.5down | -17.6down |
| Gasoline | 223.3 | -2.4down | 13.9up |
| Distillate | 113.8 | -3.2down | 7.6up |
| Propane | 102.320 | 0.806up | 16.356up |