This Week in Petroleum
Canada’s Trans Mountain Pipeline expansion may come on line early next year
Work on Canada’s Trans Mountain Pipeline expansion project is reportedly over 95% complete, and project officials expect construction to conclude early next year. When it comes onstream, the expansion is expected to nearly triple the pipeline’s current 300,000 barrels per day (b/d) capacity to move crude oil from oil sands in landlocked Alberta to the Pacific Coast for export to new customers in Asia or along the U.S. West Coast.
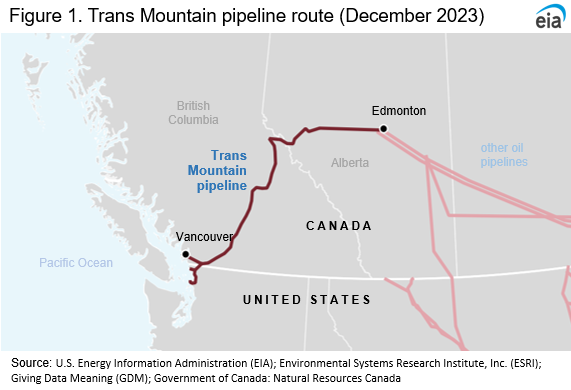
The existing Trans Mountain Pipeline currently offers one avenue for waterborne crude oil exports out of Canada by moving crude oil from Edmonton in Alberta to Burnaby, a port near Vancouver on the coast of British Columbia (Figure 1). The expansion project aims to increase the pipeline’s current capacity by 590,000 b/d for a total of 890,000 b/d of capacity.
The Canadian government acquired the pipeline from Kinder Morgan for Canadian dollars (CAD) 4.5 billion in 2018 and formed the Trans Mountain Corporation (TMC) to oversee and manage the pipeline and the expansion project. The pipeline expansion, which consists of added pipeline capacity that generally runs along a similar route to the current pipeline, has faced several legal challenges from environmental activists and Canadian First Nations groups.
If the pipeline expansion comes on line early next year as scheduled, it is likely to narrow spreads between the prices of West Canada Select (WCS) and West Texas Intermediate (WTI) crude oils. The price differential between WCS and WTI reflects both the difference in quality between light, sweet WTI and heavy, sour WCS, and the logistical constraints sellers in western Canada face in moving crude oil to potential buyers. Increased pipeline availability to ship Canada’s heavy crude oil to buyers in Asia or along the U.S. West Coast will increase the number of potential buyers, likely increasing competition among buyers and increasing relative prices. The effects of more buyers for Canadian crude will likely be tempered because buyers will still need complex, high-conversion refinery facilities featuring more advanced refinery units such as cokers to profitably refine most heavy grades. Shipping costs and limitations on port access in Burnaby are likely to present challenges for Canadian maritime exports. Pipelines supplying the central United States are still likely to be the most cost-effective modes of transport.
Canada’s crude oil production increased steadily for most of the last 13 years (Figure 2), with Canada’s average annual crude oil and condensate production rising nearly 2.0 million b/d between 2009 to 2019. In 2020, the effects of the COVID-19 pandemic decreased crude oil production because of significant declines in crude oil prices. Canada’s production has since resumed its growth trend. In 2021 and 2022, Canada’s production exceeded pre-pandemic levels, with 2022 crude oil and condensate production averaging 4.9 million b/d, according to data from the Canada Energy Regulator (CER).

Most new growth in Canada’s crude oil production is concentrated in the land-locked province of Alberta: in 2022, Alberta’s crude oil production accounted for 82.7% of total crude oil production in Canada, up from 76.1% in 2012.
Alberta’s crude oil is primarily extracted from bituminous oil sands in northeastern Alberta, which produce a particularly heavy grade of crude oil, as indicated by its low API gravity. Regional crude oil producers must employ specialized technologies to extract, upgrade, and transport the heavy crude oil, which sells at a significant discount to lighter crude oil grades, such as the U.S. benchmark WTI and the global benchmark Brent grades.
Priced at Hardisty, Alberta, WCS is the most widely used benchmark grade for assessing heavy crude oil prices in Alberta. WCS has an API gravity of just over 20 degrees, compared with about 38 degrees for Brent and 42 degrees for WTI. In 2022, the price difference between WCS and WTI (priced at Cushing, Oklahoma) averaged $21 per barrel (b) (Figure 3).

The annual average discount for WCS this year is likely to be less than in 2022 because of narrow discounts in the summer—particularly in June when the WCS discount to WTI narrowed to just $11/b. However, the spread has widened again in the second half of 2023, increasing to an average of $26/b in October and $25/b in November. Refinery maintenance and reduced refinery runs in the United States may have contributed to the widening WCS discount to WTI in recent months.
Unlike WTI, WCS exports are limited by a lack of infrastructure to move crude oil to alternative destinations outside of either the United States or Canada. Currently, the United States imports the most crude oil from Canada by a wide margin; U.S. imports from Canada have averaged about 3.7 million b/d since 2020, according to our Petroleum Supply Monthly (Figure 4). That figure implies that U.S. imports of crude oil from Canada accounted for about 79% of Canada’s total crude oil production during that time. The volume of imports also means Canada is the largest source of crude oil imports for the United States, and these imports primarily flow to refineries in the Midwest (PADD 2) and the U.S. Gulf Coast (PADD 3).

Given the limited ability to export Canada’s crude oil to waterborne markets, the only viable destinations for most of Canada’s crude oil are nearby refinery hubs via pipelines or costly rail shipments. WTI, which is primarily produced in inland Texas, faced similar priced discounts relative to Brent for several years until large volumes of pipeline capacity came on line to carry crude oil to coastal export hubs in Houston and Corpus Christi.
Significant opposition to the pipeline expansion has created uncertainty for the project throughout its development. In September, CER approved a route change for a 0.8-mile section of pipeline near Kamloops, British Columbia, to avoid planned micro-tunneling construction. According to TMC, if the route change had not been approved, the pipeline’s completion may have been delayed until December 2024. The Stk’emlupsemc Te Secwepemc Nation (SSN), a First Nations group, opposed the change. From November 2 to November 14, CER ordered a temporary halt to construction on the project in a wetland area near Abbotsford, British Columbia, after inspectors found several environmental- and safety-related noncompliance issues. Construction reportedly resumed after the issues were addressed.
On November 30, CER approved preliminary interim tolls for the expanded Trans Mountain pipeline system, contingent on additional information being provided by December 15. The pricing approval is another indicator that the expansion may soon be ready to begin moving crude oil.
For questions about This Week in Petroleum, contact the Petroleum and Liquid Fuels Markets Team at 202-586-5840.
Retail prices (dollars per gallon)

|

|
| Retail prices | Change from last | ||
|---|---|---|---|
| Gasoline | 12/04/23 | Week | Year |
| U.S. | 3.231 | -0.007down | -0.159down |
| East Coast | 3.206 | 0.051up-arrow | -0.148down-arrow |
| Midwest | 2.991 | -0.040down-arrow | -0.221down-arrow |
| Gulf Coast | 2.738 | 0.028up-arrow | -0.070down-arrow |
| Rocky Mountain | 3.015 | -0.091down-arrow | -0.389down-arrow |
| West Coast | 4.252 | -0.111down-arrow | -0.117down-arrow |

|

|
| Retail prices | Change from last | ||
|---|---|---|---|
| Diesel | 12/04/23 | Week | Year |
| U.S. | 4.092 | -0.054down-arrow | -0.875down-arrow |
| East Coast | 4.139 | 0.018up-arrow | -1.052down-arrow |
| Midwest | 4.025 | -0.090down-arrow | -0.882down-arrow |
| Gulf Coast | 3.737 | -0.056down-arrow | -0.787down-arrow |
| Rocky Mountain | 4.128 | -0.076down-arrow | -1.122down-arrow |
| West Coast | 4.912 | -0.085down-arrow | -0.590down-arrow |

|

|
| Retail prices | Change from last | ||
|---|---|---|---|
| 12/04/23 | Week | Year | |
| Heating Oil | 4.134 | -0.039down | -0.721down |
| Propane | 2.437 | 0.005up | -0.241down |
Futures prices (dollars per gallon*)

|

|

|
|
| Futures prices | Change from last | ||
|---|---|---|---|
| 12/01/23 | Week | Year | |
| Crude oil | 74.07 | -1.47down | -5.91down |
| Gasoline | 2.121 | -0.044down | -0.159down |
| Heating oil | 2.662 | -0.174down | -0.507down |
| *Note: Crude oil price in dollars per barrel. | |||
Stocks (million barrels)

|

|

|

|
| Stocks | Change from last | ||
|---|---|---|---|
| 12/01/23 | Week | Year | |
| Crude oil | 445.0 | -4.6down | 31.1up |
| Gasoline | 223.6 | 5.4up | 4.5up |
| Distillate | 112.0 | 1.3up | -6.8down |
| Propane | 96.967 | -1.771down | 7.289up |