Commuting Patterns and Characteristics of Fifth District Counties
This article extends our previous work on the categorization of counties in the Fifth District based on their economic connectivity. Using commuting patterns to proxy for connectivity, we group counties into four categories. We next compare our classification with the USDA/ERS RUCC classification system. Finally, we characterize each category using different socioeconomic indicators. We claim that the information conveyed by this study is relevant when designing regionally targeted policies.
Commuting flows allow labor markets to extend across geographies. They also reveal how residents cross boundaries to access employment opportunities in neighboring jurisdictions. Beyond work-related travel, these flows suggest broader interactions, such as commerce or recreation. In essence, commuting patterns reflect the degree of economic and social connectivity across locations.
This article investigates the commuting dynamics within the Fifth District,1 focusing on intracounty, outflow and inflow movements. Our primary objectives are twofold:
- To categorize counties based on their observed commuting patterns
- To provide a comprehensive characterization of each resulting category
Our analysis centers on four distinct categories, each grouping counties characterized by their unique commuting patterns.
Our main message is that the design of regional development programs should consider that the outcomes may vary across counties with different levels and types of connectivity. While existing classifications (notably the Rural-Urban Continuum Codes [RUCC] from the U.S. Department of Agriculture's Economic Research Service [USDA/ERS]) serve as valuable reference points, we seek to offer an alternative that complements those classifications.
Specifically, we aim to see how our framework of analysis could enhance the understanding of regional dynamics beyond established classifications. This allows us to contribute to the broader research on commuting patterns and their implications for economic development and policy.
Methodology of Our Commuting Pattern Analysis
LODES Data and Commuting Definitions
We begin by describing the general patterns of commuting flows in the Fifth District. Our analysis uses the 2019 LEHD Origin-Destination Employment Statistics (LODES).2 The LODES data provide information on where workers live and work at the block level, along with select economic and demographic characteristics. For our analysis, we aggregate these commuting flows at the county level.
Counties exhibit distinct commuting behaviors: An individual county receives workers from other counties (commuting inflows), sees some residents commute to jobs in other counties (commuting outflows) and still other residents live and work within its borders (intracounty commuting).
To ensure consistency in cross-county comparisons, we adopt the same approach as the one used in our previous article "Commuting Patterns and Economic Connectivity in the Fifth District." Outflows from each county are expressed as a share of the resident workforce residing within the county's boundaries. Conversely, both inflows from other counties and intracounty commuting are expressed as a share of the total employed workforce within each county.
Virginia's Counties and Independent Cities
This article uses the Bureau of Economic Analysis' (BEA's) approach for aggregating select independent cities and surrounding counties in Virginia. Politically, independent cities are the functional equivalent of counties. There are 38 independent cities in Virginia (versus only three in the rest of the U.S.), and they vary significantly in terms of size and economic connectedness to their surrounding counties. Smaller independent cities tend to have higher commuting inflows and outflows, meaning they pull median measures for inflows and outflows for the Fifth District up when treated as county equivalents.
Adopting the BEA's approach for this analysis avoids overstating intercounty commuting levels in this way. For instance, the median share of commuting inflows when treating all independent cities as counties was 56.2 percent, versus 54.4 percent when smaller independent cities are aggregated with their surrounding counties.
Commuting Patterns in the Fifth District
Median county commuter flows vary a lot across states in the Fifth District. Figure 1 shows that Virginia and South Carolina exhibit median outflow rates above the Fifth District median. Washington, D.C. — which represents a single county — is by far the district with the largest median inflow rate, followed by Virginia. West Virginia has the largest median intracounty commuting rates.

Commuting flows also vary significantly at the county level, as seen in Figures 2-4. Clustered counties with relatively high inflow and outflow rates — such as those in the central Virginia region — are indicative of cross-commuting patterns among neighboring and nearby counties. At the other extreme, several counties with relatively high inflow rates are adjacent to counties with lower inflow rates, such as Botetourt County in western Virginia or Bladen County in southeast North Carolina. Counties with relatively high outflow rates do not follow a similar geographic pattern.


Looking across Fifth District counties, we observe the following median commuting behavior:
- Outflow: About 65.7 percent of residents commute out of their home counties to work elsewhere.
- Inflow: Around 54.4 percent of local employees commute into the county from other areas.
- Intracounty: About 45.6 percent of the people who work in the county (complement of the inflow rate) are county residents.
These numbers, however, mask a large degree of dissimilarity across counties within the Fifth District, as seen in Figure 5. Notably, the distribution of outflow rates is less concentrated (as measured by a standard deviation of 13.9 percent) than the inflow and intracounty distributions (which both have standard deviations of 10.4 percent).

Categorization
The complex dynamics of commuting patterns within a region indicate how economic activity, spatial connectivity and workforce mobility mesh. In this article, we extend our previous work by categorizing counties within the Fifth District based on their distinctive commuting behaviors.
Comparing a county's commuting outflow and inflow rates to median rates for the Fifth District yields four distinct categories, each revealing unique characteristics and implications.3
Connected Counties: High Inflows and Outflows
Connected counties includes counties where commuting flows exhibit robust bidirectionality. These counties (shown in the northeast section of Figure 6) attract workers from neighboring jurisdictions and simultaneously export their labor forces. Prince George's County in Maryland and Arlington and the City of Alexandria in Virginia (all of which share a border with D.C.) are examples of Connected counties.
Bedroom Community Counties: Low Inflows, High Outflows
Bedroom Community counties predominantly experience outward mobility. Residents in these counties often commute to neighboring urban centers for employment, contributing to the daily workforce influx in those areas. However, their inflows remain modest. These counties (located primarily in the southeast section of Figure 6) serve as residential areas, places where workers reside but seek economic opportunities elsewhere. Bedroom Community counties could play a crucial role in supporting the labor needs of adjacent Employment Centers. In North Carolina, Stanly County is an example of a Bedroom Community for Charlotte, as about 16 percent of employed people living in Stanly County worked in Charlotte in 2019.
Employment Center Counties: High Inflows, Low Outflows
The Employment Center category includes counties characterized by substantial inflows but limited outflows. These counties (clustered in the northwest section of Figure 6) act as magnets for workers from surrounding regions. Their inflows result from thriving job markets and diverse industries. Yet, the relatively low outflows suggest that these counties retain their workforces, creating a concentration of economic activity. Counties in this category could play a key role in regional development and infrastructure planning. The City of Richmond, the City of Baltimore, and Washington, D.C., are among the Employment Centers in the Fifth District.
Intracounty Commuting Counties: Low Inflows and Outflows
Intracounty Commuting counties exhibit the smallest commuting flows both inward and outward. These counties (in the southwest section of Figure 6) represent areas where residents predominantly work within their boundaries and, correspondingly, where local jobs predominately employ local workers. They lack the degree of mobility observed elsewhere. Understanding the factors shaping intracounty dynamics is important for sustainable development. Intracounty Commuting counties in the Fifth District include Kanawha County in West Virginia (where Charleston is located), Mecklenburg County in North Carolina (where Charlotte is located) and the City of Virginia Beach in Virginia.

As Figure 7 shows, Virginia has the largest share of Connected counties in the Fifth District followed by South Carolina. D.C. stands out as an Employment Center, while Bedroom Community counties are relatively more common in West Virginia.

Figure 8 shows that while Connected counties are geographically clustered in Virginia, Maryland and South Carolina, they are much more spread out in North Carolina. In West Virginia, Intracounty Commuting counties are in the state's mountainous areas.

Comparing Our Approach With the RUCC Classification
The USDA/ERS maintains several geographic classification systems to designate areas by their degree of rurality. The underlying assumption is that economic outcomes tend to vary across the rural-urban continuum. The classifications are designed to provide a standardized framework for capturing the inherent internal variation that characterizes both rural and urban areas. This framework facilitates nuanced and context-dependent analyses.4
We next examine how much our proposed categorization scheme overlays with the existing ERS classifications. We focus here on establishing a comparison with the RUCC system, which is defined at the county level. While RUCCs primarily consider a county's urbanization level and proximity to a metropolitan area, our framework introduces an additional contextual dimension: the county's economic ties to other regions.
Counties coded RUCC 1, 2 or 3 are generally classified as urban (metro) counties, while those coded RUCC 4-9 are designated as rural (nonmetro) counties. Our analysis, however, shows that counties classified as RUCC 2 (metro with population of 250,000 to 1 million) and RUCC 6 (nonmetro, with population of 2,500 to 19,999 and adjacent to a metro area) exhibit a remarkable degree of similarity according to the proposed categorization scheme, despite their distinct groupings within the RUCC system.
Additional key takeaways from this analysis are:
- Among metros (RUCC 1-3), large metros are most likely to be Connected, while smaller metros are more likely to be Intracounty Commuting.
- Large nonmetros (RUCC 4 and 5) are more likely than smaller nonmetros (RUCC 6-9) to be Intracounty counties (75 percent for large nonmetros, versus 29 percent to 67 percent for mid/small nonmetros).
- Metro-adjacent nonmetros (RUCC 4, 6 and 8) are more likely than similar-sized non-adjacent nonmetros (RUCC 5, 7 and 9, respectively) to be Connected counties.
- Metro-adjacent mid/small nonmetros (RUCC 6 and 8) are more likely to be Bedroom Communities or Employment Centers than similarly sized non-adjacent nonmetros (RUCC 7 and 9, respectively).

Characterizing the Four Categories
Following the identification of the four distinct categories, we now intend to offer a general characterization of each. The analysis emphasizes the importance of acknowledging not only the broad differences between the categories (established in this case by county commuting behavior), but also the variability that may exist within each classification category (internal variation).
We underscore, however, that this characterization does not intend to support nor establish a causal relationship. Rather, our focus lies in understanding the complex dynamics of commuting behaviors and their implications for regional development and policy. The variables considered in the analysis include labor market characteristics in terms of local employment by sector and resident labor market activity, resident income characteristics, and resident demographics in terms of educational attainment and age.
Labor Market Characteristics
Both labor force participation (Figure 10) and the employment-population ratio (Figure 11) are greater among residents in Connected and Employment Center counties while being lowest for Bedroom Communities. However, compared to Intracounty Commuting counties, Bedroom Communities exhibit a higher degree of dissimilarity among each other.


We also examined local industry diversity within each category of counties. We use the Shannon-Weaver Index (SWI) as a measure of industry diversity within a county. The index assesses the extent to which employment is evenly distributed among various industries. Specifically, the SWI compares the actual distribution of employment across industries to a hypothetical scenario where all industries employ workers in equal proportions. The index ranges from zero (indicating minimum diversity or complete specialization) to 1 (maximum diversity, all industries are present, and employment is evenly distributed across them).
We calculate county-level SWIs based on two-digit NAICS codes for the Fifth District and use this information to characterize each of the previously defined categories.
Employment Centers have the largest median and average SWI relative to the other categories (indicating high industry diversity), while Bedroom Communities have the lowest (indicating more specialization). It should be emphasized, however, that even though Connected Communities and Intracounty Commuting counties have about the same median SWI, the distribution within the Connected group is more spread out. This indicates a wider range of industry mix within Connected counties, compared to the more concentrated industry mix in Intracounty Commuting areas.

Resident Income Characteristics
Household earning characteristics suggest that Connected counties are relatively affluent. They have the lowest poverty rates (Figure 13) and largest median household income (Figure 14) among the four categories, even though both measures vary considerably.
By contrast, counties in the Intracounty Commuting category have the largest poverty rates and tend to be more like each other in terms of this variable. Bedroom Communities have about the same median household income as Intracounty Commuting counties but a much more disperse distribution.


Resident Demographics
Educational attainment — as measured by a county's share of residents ages 25 and older with a bachelor's degree or higher — exhibits the most pronounced variation across the categories, as seen in Figure 15. Employment Centers have the highest proportion of residents with such degrees. Conversely, Bedroom Communities exhibit the lowest share.
This contrast, however, extends beyond the median or average of each category. The variability among the counties within the Bedroom Community group is remarkable small in terms of educational attainment, while Employment Centers appear to include a more dissimilar set of counties.

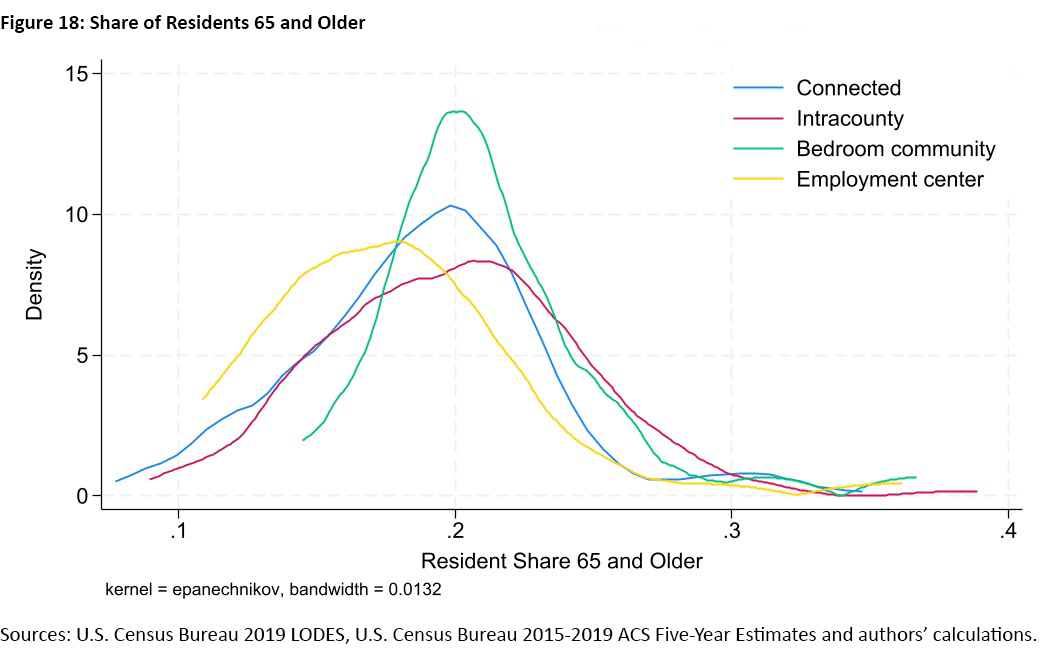
Although residents under age 18 represent similar shares of the population across the four categories (as seen in Figure 16), adult resident age characteristics vary across the four categories. In Employment Centers, residents are more likely to be between the ages of 18 and 64 (as seen in Figure 17), although counties in this category exhibit the largest degree of dissimilarity by this measure. In Bedroom Communities and Intracounty Commuting counties, residents are relatively more likely to be age 65 or older, as seen in Figure 18. The distributions of these measures are relatively concentrated in the Bedroom Community category.


Conclusions
Our analysis underscores the relationship between economic connectivity (proxied by county-level commuting patterns) and regional dynamics and opportunities. To examine the relationship between connectivity and socioeconomic well-being, we classified counties in the Fifth District into four categories based on their commuting behavior. We then examined a range of socioeconomic indicators to explore how these characteristics systematically differed across the categories and the extent to which they varied within each category.
Within the Fifth District, commuting characteristics varied depending on a county's rurality. While large metropolitan counties are most likely to be connected (exhibiting both high commuter outflow and inflow rates), intracounty commuting patterns are more common among smaller metropolitan counties. Nonmetropolitan counties are more likely to be categorized Intracounty Commuting overall, but those adjacent to metropolitan counties are more connected than nonmetropolitan counties with similar population.
While Connected counties and Employment Centers demonstrate higher levels of labor force participation, employment rates and industry diversity, Bedroom Communities exhibit a more specialized economic profile, lower median household income and higher poverty rates.
Disparities in educational attainment and demographic composition further highlight the complex nature of regional economies. Employment Centers tend to have a higher share of residents with higher educational attainment and a larger share of residents in the 18-64 age group. Counties in the Bedroom Community category have a lower share of residents with a bachelor's degree or higher, a lower share of residents between 18 and 64 years old, and a higher share of residents 65 or older.
Recognizing these disparities is crucial for the design of effective regional policies aimed at promoting economic growth and reducing socioeconomic disparities. Tailored interventions that leverage the strengths and address the challenges of each community type are essential for promoting sustainable regional development. The insights of our analysis could provide policymakers additional tools to better address the challenges and opportunities inherent in regional economic connectivity.
Sierra Latham is a senior research analyst and Santiago Pinto is a senior economist and policy advisor in the Research Department at the Federal Reserve Bank of Richmond.
The Fifth Federal Reserve District includes the District of Columbia, Maryland, North Carolina, South Carolina, Virginia and most of West Virginia.
Although LODES data are available for 2020 and 2021, we chose to focus on 2019 to assess commuting patterns that were not influenced by employment and remote work decisions made in response to the COVID-19 pandemic.
For robustness, we conducted a sensitivity analysis, varying the inflow and outflow thresholds that determine the categories. Our findings remain largely unaffected by these changes.
Examples of these classification systems include the RUCC, the Urban Influence Codes (UIC), and the Farm Analysis Regions (FAR) and the Rural-Urban Commuting Area (RUCA) codes.
To cite this Economic Brief, please use the following format: Latham, Sierra; and Pinto, Santiago. (August 2024) "Commuting Patterns and Characteristics of Fifth District Counties." Federal Reserve Bank of Richmond Economic Brief, No. 24-24.
This article may be photocopied or reprinted in its entirety. Please credit the authors, source, and the Federal Reserve Bank of Richmond and include the italicized statement below.
Views expressed in this article are those of the authors and not necessarily those of the Federal Reserve Bank of Richmond or the Federal Reserve System.
Receive a notification when Economic Brief is posted online.