


97 posts on "Inequality"
July 3, 2024
On the Distributional Consequences of Responding Aggressively to Inflation

This post discusses the distributional consequences of an aggressive policy response to inflation using a Heterogeneous Agent New Keynesian (HANK) model. We find that, when facing demand shocks, stabilizing inflation and real activity go hand in hand, with very large benefits for households at the bottom of the wealth distribution. The converse is true however when facing supply shocks: stabilizing inflation makes real outcomes more volatile, especially for poorer households. We conclude that distributional considerations make it much more important for policy to take into account the tradeoffs between stabilizing inflation and economic activity. This is because the optimal policy response depends very strongly on whether these tradeoffs are present (that is, when the economy is facing supply shocks) or absent (when the economy is facing demand shocks).
July 2, 2024
On the Distributional Effects of Inflation and Inflation Stabilization

This post and the next discuss the distributional effects of inflation and inflation stabilization through the lenses of a theoretical model—a Heterogeneous Agent New Keynesian (HANK) model. This model combines the features of New Keynesian models that have been the workhorse for monetary policy analysis since the work of Woodford (2003) with inequality in wealth and income at the household level following the seminal contribution of Kaplan, Moll, and Violante (2018). We find that while inflation hurts everyone, it hurts the poor in particular. When the source of inflation is a supply shock, fighting inflation aggressively hurts the poor even more, however, while the opposite is true for demand shocks, as discussed in the companion post.
June 28, 2024
Racial and Ethnic Inequalities in Household Wealth Persist

Disparities in wealth are pronounced across racial and ethnic groups in the United States. As part of an ongoing series on inequality and equitable growth, we have been documenting the evolution of these gaps between Black, Hispanic, and white households, in this case from the first quarter of 2019 to the fourth quarter of 2023 for a variety of assets and liabilities for a pandemic-era picture. We find that real wealth grew and that the pace of growth for Black, Hispanic, and white households was very similar across this timeframe—yet gaps across groups persist.
Posted at 7:00 am in Equitable Growth, Household Finance, Inequality, Pandemic | Permalink | Comments (0)
May 8, 2024
How Are They Now? A Checkup on Homeowners Who Experienced Foreclosure

The end of the Great Recession marked the beginning of the longest economic expansion in U.S. history. The Great Recession, with its dramatic housing bust, led to a wave of home foreclosures as overleveraged borrowers found themselves unable to meet their payment obligations. In early 2009, the New York Fed’s Research Group launched the Consumer Credit Panel (CCP), a foundational data set of the Center for Microeconomic Data, to monitor the financial health of Americans as the economy recovered. The CCP, which is based on anonymized credit report data from Equifax, gives us an opportunity to track individuals during the period leading to the foreclosure, observe when a flag is added to their credit report and then—years later—removed. Here, we examine the longer-term impact of a foreclosure on borrowers’ credit scores and borrowing experiences: do they return to borrowing, or shy away from credit use and homeownership after their earlier bad experience?
February 7, 2024
Wealth Inequality by Age in the Post‑Pandemic Era
Editor’s note: Since this post was first published, percentages cited in the first paragraph have been corrected. (February 7, 1pm)

Following our post on racial and ethnic wealth gaps, here we turn to the distribution of wealth across age groups, focusing on how the picture has changed since the beginning of the pandemic. As of 2019, individuals under 40 years old held just 4.9 percent of total U.S. wealth despite comprising 37 percent of the adult population. Conversely, individuals over age 54 made up a similar share of the population and held 71.6 percent of total wealth. Since 2019, we find a slight narrowing of these wealth disparities across age groups, likely driven by expanded ownership of financial assets among younger Americans.
Racial and Ethnic Wealth Inequality in the Post‑Pandemic Era
Editor’s note: Since this post was first published, the authors updated their analysis to focus on the household level of wealth rather than the aggregate level. Please refer to the new blog post and findings here Racial and Ethnic Inequalities in Household Wealth Persist. (June 28, @ 7:19am)

Wealth is unevenly distributed across racial and ethnic groups in the United States. In this first post in a two-part series on wealth inequality, we use the Distributional Financial Accounts (DFA) to document these disparities between Black, Hispanic, and white households from the first quarter of 2019 to the third quarter of 2023 for wealth and a variety of asset and liability categories. We find that these disparities have been exacerbated since the pandemic, likely due to rapid growth in the financial assets more often held by white individuals.
Posted at 10:00 am in Demographics, Financial Markets, Inequality, Pandemic | Permalink | Comments (2)
January 10, 2024
An Overlooked Factor in Banks’ Lending to Minorities
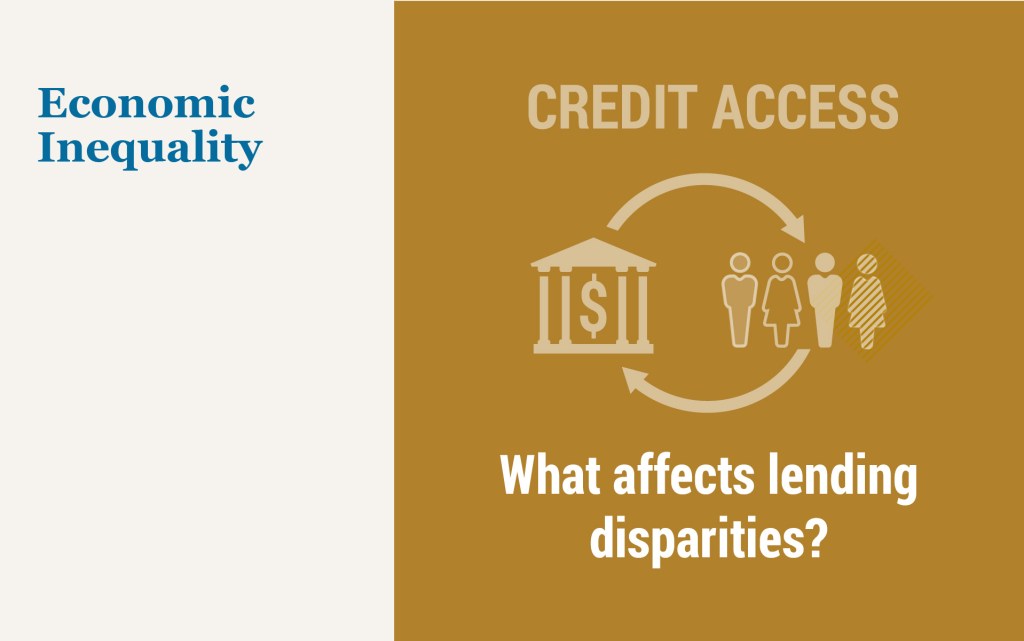
In the second quarter of 2022, the homeownership rate for white households was 75 percent, compared to 45 percent for Black households and 48 percent for Hispanic households. One reason for these differences, virtually unchanged in the last few decades, is uneven access to credit. Studies have documented that minorities are more likely to be denied credit, pay higher rates, be charged higher fees, and face longer turnaround times compared to similar non-minority borrowers. In this post, which is based on a related Staff Report, we show that banks vary substantially in their lending to minorities, and we document an overlooked factor in this difference—the inequality aversion of banks’ stakeholders.
January 8, 2024
Measuring Price Inflation and Growth in Economic Well‑Being with Income‑Dependent Preferences

How can we accurately measure changes in living standards over time in the presence of price inflation? In this post, I discuss a novel and simple methodology that uses the cross-sectional relationship between income and household-level inflation to construct accurate measures of changes in living standards that account for the dependence of consumption preferences on income. Applying this method to data from the U.S. suggests potentially substantial mismeasurements in our available proxies of average growth in consumer welfare in the U.S.
December 1, 2023
Recent Disparities in Earnings and Employment

The New York Fed recently released its latest set of Equitable Growth Indicators (EGIs). Updated quarterly, the EGIs continue to report demographic and geographic differences in inflation, earnings (real and nominal), employment, and consumer spending (real and nominal) at the national level. This release also launches a set of national wealth EGIs (which will be examined more closely on Liberty Street Economics early next year). Going forward, EGI releases will also include a set of regional EGIs, which will present disparities in inflation, earnings (real and nominal), employment, and consumer spending (real and nominal) in our region. Drawing on the just released EGIs, in this post, we present recent gender gaps in the labor market at the national and regional levels. We provide a picture of how gender wage and employment disparities have evolved since the pandemic, examining and contrasting gaps at the national and regional level. We find that the gaps between the employment rates and earnings of men and women have declined steadily following the pandemic, but have declined perceptibly more so in our region than in the nation.
Posted at 7:00 am in Demographics, Inequality, New Jersey, New York, Regional Analysis, Unemployment | Permalink
November 17, 2023
Flood‑Prone Basement Housing in New York City and the Impact on Low‑ and Moderate‑Income Renters

Hurricane Ida, which struck New York in early September 2021, exposed the region’s vulnerability to extreme rainfall and inland flooding. The storm created massive damage to the housing stock, particularly low-lying units. This post measures the storm’s impact on basement housing stock and, following the focus on more-at-risk populations from the two previous entries in this series, analyzes the attendant impact on low-income and immigrant populations. We find that basements in select census tracts are at high risk of flooding, affecting an estimated 10 percent of low-income and immigrant New Yorkers.
 RSS Feed
 Follow Liberty Street Economics