As earnings season concludes, we review the S&P 500 2024 Q1 earnings season in more detail, providing both aggregate and company-level insights using data from I/B/E/S, StarMine, and Datastream, which are all found in the desktop solution LSEG Workspace.
Earnings Commentary
2024 earnings are off to a strong start with a resilient Q1 earnings season which exceeded analyst expectations for the fifth consecutive quarter. The current earnings growth rate of 8.0% surpassed the start-of-quarter estimate of 5.0%. However, it is important to note that this figure was deflated due to a one-time item from Bristol Myers Squibb. When adjusting for this anomaly, the adjusted earnings growth rate improves to 11.2%, yielding a 620-basis point improvement throughout the quarter.
The Magnificent-7 continues to play a significant role whose aggregate earnings growth rate was 51.7% this quarter. However, when stripping out the impact of the Mag-7, the Q1 aggregate earnings growth rate declines to 1.6%. According to analyst expectations, we should see a broadening of earnings growth contribution as we move into the second half of the year, with expectations that the rest of the index will play a larger role in driving overall earnings growth.
The revenue beat rate of 61.1% follows a similar patten to prior three quarters and is noticeably lower than the 70-80% beat rate seen in prior years. The revenue surprise rate of 1.1% this quarter is also below the prior four-quarter average of 1.5% and long-term surprise rate of 1.3%.
Looking ahead, the forecast for Q2 aggregate earnings is projected to reach $495.7 billion. If realized, this would set a new all-time high, surpassing the previous high watermark of $490.0 billion set in Q3 2023. The forward 12-month price-to-earnings (P/E) ratio stands at 20.6x, placing it in the 86th percentile according to LSEG Datastream.
Part 1 – Earnings and Revenue Beat/Surprise Rate
Using data from the May 31st S&P 500 Earnings Scorecard, 97.8% of companies have reported results. Of the 489 companies that have reported, 78.3% reported earnings above analyst expectations, which is slightly below the prior four-quarter average of 78.5% and well-above the long-term average of 66.8%.
At a sector level, five sectors posted an earnings beat rate above its prior four-quarter average (Consumer Staples, Financials, Health Care, Real Estate, and Communication Services).
From a breadth perspective, we calculate the following datapoints (of the 489 companies that have reported earnings):
- 55.6% of constituents reported both an earnings and revenue beat. This was led by Health Care, Information Technology, and Real Estate.
- 12.9% of constituents reported both an earnings and revenue miss. This was led by Utilities, Consumer Discretionary, and Communication Services.
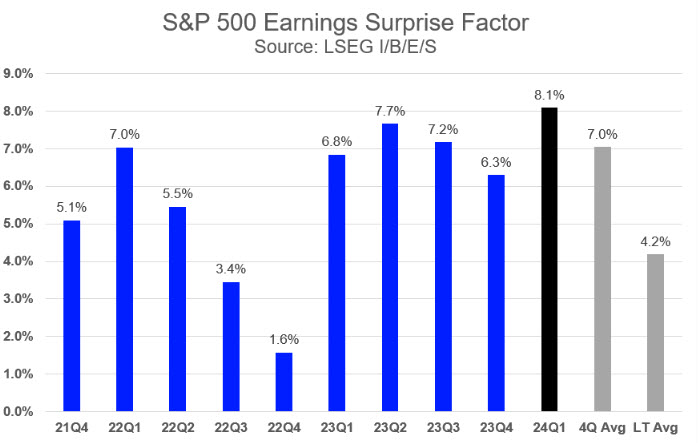
The aggregate earnings surprise factor (actual vs. mean estimate on day of reporting) of 8.1% is the highest since 2021 (Exhibit 1) and surpasses both the prior four-quarter average of 7.0% and long-term average of 4.2%. The largest contributors to the earnings surprise rate are as followed: Alphabet, Pfizer, Amazon.com, Nvidia, Citigroup, and Berkshire Hathaway. This group contributed roughly one-third of the overall earnings surprise this quarter.
The aggregate revenue surprise of 0.6% is below the prior four-quarter average of 1.5% and below the long-term average of 1.3%.
From a breadth perspective, we calculate the following datapoints (of the 489 companies that have reported earnings):
- 38.2% of constituents reported an earnings surprise above 8.1%.
- 6.7% of constituents reported an earnings surprise below -8.1%.
- 60.1% of constituents reported a revenue surprise above 0.6%.
- 29.4% of constituents reported a revenue surprise below -0.6%.
Exhibit 1: S&P 500 Earnings Surprise Rate
Using LSEG Workspace, we utilize the Earnings Season app to highlight price reaction post earnings result (Exhibit 2). We observe that on aggregate, price reaction was muted with companies who beat analyst expectations saw an average price increase of 0.8% while those who missed saw an average price decline of 0.8%.
At a sector level, we note that Information Technology, Health Care, and Utilities saw the largest price increase for beating analyst expectations. Conversely, Information Technology, Consumer Staples, and Health Care saw the largest price declines after missing analyst expectations.
Users can customize the app to overlay additional columns of data. In this example, we highlight two columns including ‘IV Market Implied 5 Year EPS CAGR’ and ‘IV Forward 5 Year EPS CAGR’ which gives an indication as to which sectors contain stocks with ‘high growth expectations’. This occurs when the Market Implied growth rate far exceeds the Forward 5-year SmartEstimate growth rate.
Unsurprisingly, Information Technology is an example of this with a Market Implied growth rate of 18.8% vs. a Forward 5-year SmartEstimate growth rate of only 11.3%. This highlights high expectations placed on the sector by investors and can be used to corroborate price reactions post-results.
For more details on Market Implied vs. Forward 5-year growth rates, users can visit the StarMine Intrinsic Valuation Model (IV), which is a valuation model based on the dividend discount model.
Exhibit 2: S&P 500 Post-Results Price Reaction

Source: LSEG Workspace
Part 2 – Earnings Growth/Contribution
Q1 blended earnings is currently $471.1 billion (+8.0% y/y, -0.9% q/q). This marks the second consecutive quarter of negative q/q growth.
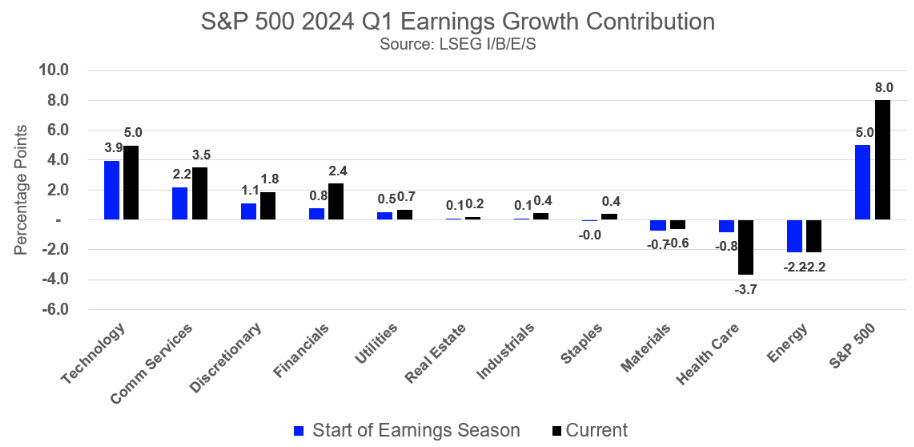
Exhibit 3 displays Q1 earnings growth in terms of earnings growth contribution, which provides a clearer way to understand which sectors were driving earnings growth.
Heading into the quarter, seven sectors were expected to deliver positive earnings growth contribution while Consumer Staples, Materials, Health Care, and Energy were expected to deliver negative earnings growth contribution – this can be seen in the blue bars.
The black bars (current values) show that every sector except for Health Care delivered stronger earnings growth compared to the start of earnings season. Financials saw the largest relative increase, followed by Communication Services and Information Technology. Health Care saw the largest relative decrease this quarter.
Exhibit 3: S&P 500 Earnings Growth Contribution
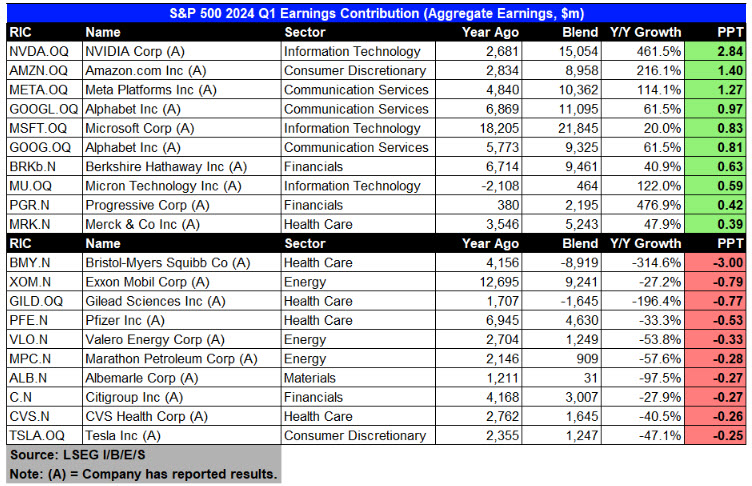
On an absolute basis, we also show a list of the individual companies that had the largest positive (negative) earnings growth contribution this quarter (Exhibit 4).
Exhibit 4: Earnings Growth Contribution by Individual Company
From a breadth perspective, we calculate the following datapoints (of the 489 companies that have reported earnings):
- 55.0% of constituents reported an earnings growth rate above 5.0%.
- 27.6% of constituents reported an earnings growth rate below -5.0%.
- 42.7% of constituents reported a revenue growth rate above 5.0%.
- 19.0% of constituents reported a revenue growth rate below -5.0%.
Part 3 – Net Profit Margin Expectations
The Q1 blended net profit margin (combining estimates and actuals) is 11.3%, a slight increase of 10 bps from the prior quarter (Exhibit 5).
Utilities saw the largest increase in profit margin expectations this quarter (181 bps, current net margin: 14.5%), followed by Real Estate (169 bps, 17.5%), and Communication Services (152 bps, 13.0%). Health Care saw the largest decline (-158 bps, 6.5%).
From a breadth perspective, we calculate the following datapoints (of the 455 constituents that have reported earnings):
- 46.0% of constituents saw their net margin increase vs. the prior quarter.
- 12.9% of constituents saw their net margin increase for two consecutive quarters.
- 5.7% of constituents saw their net margin increase for three consecutive quarters.
- 53.4% of constituents saw their net margin decrease vs. the prior quarter.
- 22.7% of constituents saw their net margin decrease for two consecutive quarters.
- 7.6% of constituents saw their net margin decrease for three consecutive quarters.
Exhibit 5: S&P 500 Net Profit Margin

At an Industry Group level (Exhibit 6), Consumer Services (653 bps) saw the largest increase this quarter, followed by Transportation (507 bps), and Equity REITs (443 bps). Pharmaceuticals, Biotechnology & Life Sciences (-758 bps) saw the largest decline this quarter, followed by Energy (-268 bps), and Insurance (-160 bps).
Exhibit 6: 2024 Q1 Net Profit Margin (Industry Group)

Part 4 – Which companies have seen the largest revisions for next quarter?
Using the Screener app within LSEG Workspace for Analysts and Portfolio Managers, we can gain valuable insights to how analysts have reacted after a company releases its financial results. Exhibit 7 shows the 30-day percent change in the consensus mean EPS estimate for 24Q2 (i.e., the next upcoming quarter).
Exhibit 7.1 is sorted by the largest downward earnings revisions for companies that have already posted results for the current earnings season period (column highlighted in blue). Said differently, we can see how analysts have revised estimates for the following quarter once a company reported results. Note: values less than -100% occur when an EPS estimate turns from positive to negative.
Exhibit 7.2 is sorted by the largest upward earnings revisions.
We also add additional columns of data for further insight – the first column shows the StarMine Analyst Revision Model (ARM) score. ARM is a stock ranking model designed to show current analyst sentiment and predict future analyst revisions by looking at estimate revisions across EPS, EBITDA, Revenue, and Recommendations over multiple time periods. We note a strong correlation between the 30-day percent change revision in consensus EPS vs. ARM score (i.e., companies that have seen their consensus EPS rise (or fall) significantly are typically associated with a high (low) ARM score.
The next two columns show the number of analysts who have upgraded or downgraded EPS estimates for the next upcoming quarter. Finally, we display the expected report date for next quarter along with the StarMine Predicted Surprise (PS%). The PS% is a powerful quantitative analytic that compares the StarMine SmartEstimate© to the consensus mean. The SmartEstimate places a higher weight on analysts who are more accurate and timelier, thus providing a refined view into consensus. Comparing the SmartEstimate to the mean estimate leads to our PS%, which accurately predicts the direction of earnings surprise 70% of the time when the PS% is greater than 2% of less than -2%.
The screener app provides a powerful workflow tool for Analysts and Portfolio Managers looking to parse through hundreds of companies during earnings season to identify thematic trends.
Exhibit 7.1: 30-day Revision (Negative) for upcoming quarter
 Source: LSEG Workspace
Exhibit 7.2: 30-day Revision (Positive) for upcoming quarter
 Source: LSEG Workspace
Conclusion
2024 Q1 earnings season once again exceeded expectations, continuing a trend of robust performance and sets a solid foundation for the remainder of the year. While growth has been concentrated among the “Magnificent-7” companies, there is optimism for a more distributed growth pattern in the coming quarters.
To subscribe to LSEG Proprietary Research reports, please click here.
LSEG Workspace is a complete solution for research and analytics. It places the most comprehensive market information, news, analytics and trading tools available into a desktop.
LSEG I/B/E/S Estimates are a market leader, boasting 200+ metrics and indicators across 15 industries. Find more information on our estimates data.
LSEG Datastream – Financial time series database which allows you to identify and examine trends, generate and test ideas and develop viewpoints on the market.
Get unique value-add analytics and predictive financial modeling, dedicated to making investment research smarter with LSEG StarMine data.


