Asset class view
- Bonds netted £2.27bn, down from the £3.58bn flows for April, although they were still the most popular asset class.
- Equity funds rebounded with £153m of net sales.
Active v passive
- Passive bond funds took £3.8bn, as their active peers lost £1.53bn.
- Contrarywise, active equity funds attracted £487m as their passive counterparts saw redemptions of £334m.
Classifications
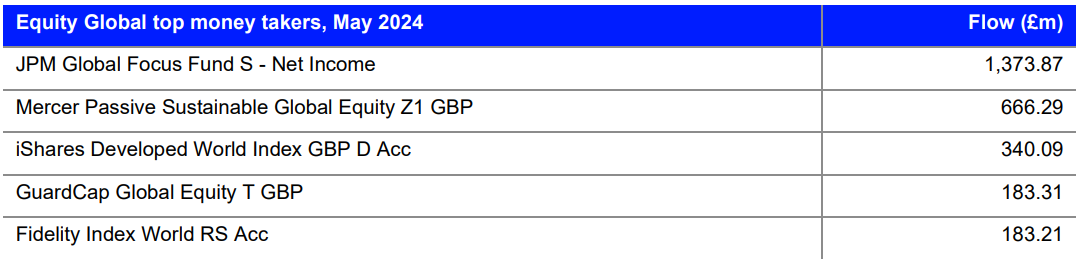
- Equity Global was the largest money taker, at £2.79bn, as active funds took the majority (£1.67bn).
- Equity UK saw the highest outflows (-£3.12bn), double that of the next on the table, Money Market GBP
(-£1.55bn).
Sustainable fund flows
- Reversing their recent negative run, sustainable funds ex-MMF took £757m.
- Sustainable equity funds attracted £679m, as their conventional peers saw outflows of £526m.
Asset manager view
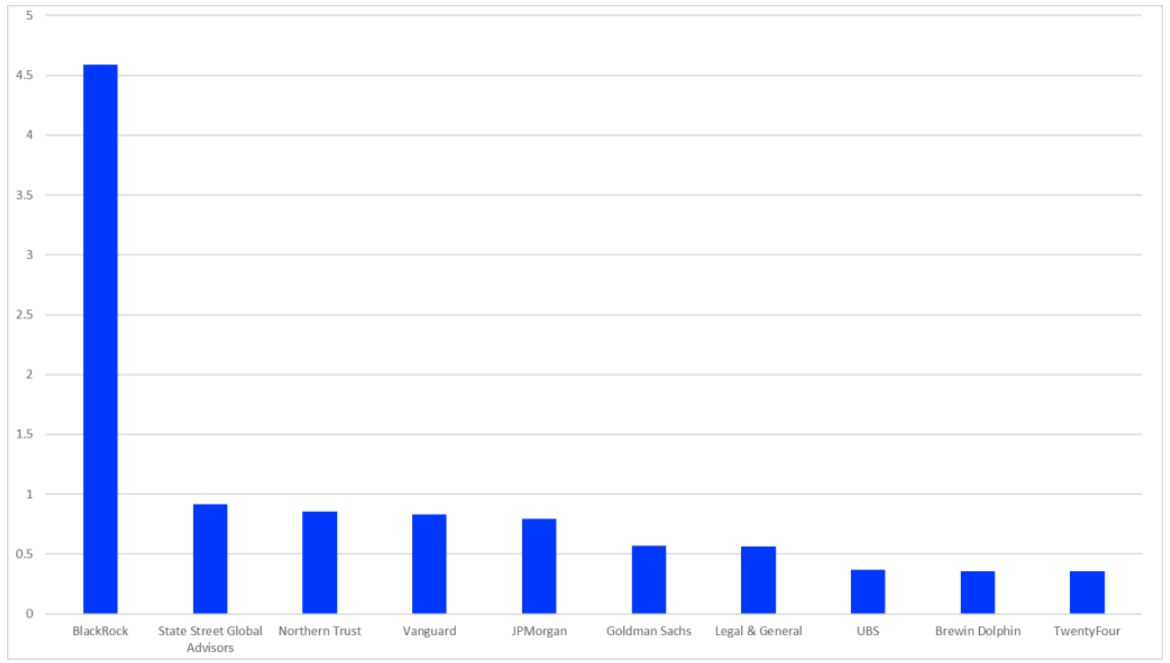
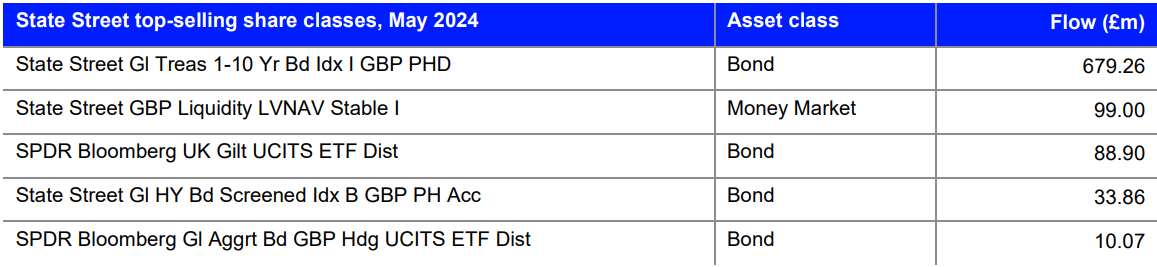
- BlackRock was May’s top money-taker, netting £4.59bn, followed by State Street with £916m.
Flows by Asset Class
Three-year flows
Chart 1: Asset Class Flows, 36 Months, to May 2024 (£bn)

Source: LSEG Lipper
Lower April inflation provided some relief in the US into May, although its Q1 GDP was revised down further from 1.6% to 1.3% on lower consumer spending. While UK inflation also fell, it was still higher than expected.
Equities and bonds rebounded in May after April falls, encouraged by strong Q1 earnings in the US, although this reversed late in the month by a bond market sell off late in the month. While equity flows turned positive for May, they are still strongly negative year to date, with redemptions of £3.73bn. These outflows were only exceeded YTD by MMFs, which saw redemptions of £4.05bn. Alternatives (-£1.27bn), real estate (-£1.23bn), and mixed assets (-£593m) have all suffered YTD redemptions.
On the plus side of the equation, YTD, bonds have seen large inflows of £9.69bn. The only other asset class to be in the black is commodities, netting £56m.
Overall, total flows YTD stand at -£1.12bn, although excluding MMFs, this rises to £2.82bn.
Active versus Passive
Chart 2: Asset Class Flows, Active and Passive, May 2024 (£bn)

Source: LSEG Lipper
Funds overall saw outflows of £60m in May, although excluding MMFs this rises to inflows of £1.37bn. It was another good month for index-tracking funds, as long-term active funds shed £2bn, while their passive equivalents attracted £3.37bn.
The global bond sell off late in the month doesn’t seem to have fully fed through into bond fund flows, as these saw the strongest sales, netting £2.28bn. This splits between £1.53bn of outflows from actively managed funds, and inflows of £3.8bn in trackers. Equity funds bucked the trend, with active funds seeing inflows of £487m and passives losing £334m, with net flows of £153m.
Meanwhile, alternatives suffered outflows of £391m (active, -£238m; passive, -£153m); mixed assets saw net outflows of £527m, though with small inflows of £70m into passive products; and real estate funds shed £127m, all active.
ETFs and Passive Mutual Funds
Chart 3: Passive Asset Class Flows, Mutual Funds v ETFs, May 2024 (£bn)

Source: LSEG Lipper
Equity passive products again reversed trend month on month, as mutual fund saw outflows of £334m and ETFs had inflows of £380m. However, the bulk of flows again went into bond mutual funds (£3.13bn) and ETFs (£670m), collectively broadly in line with April.
Passive alternatives saw outflows of £153, almost entirely from mutual funds.
Flows, whether positive or negative, were modest in other asset classes: money market, (£49m mutual funds/£13m ETFs), commodities, (-£13m/£4m); and mixed assets, (£63m from mutual funds).
Flows by Classification
Largest inflows
Chart 4: Largest Positive Flows by LSEG Lipper Global Classification, May 2024 (£bn)

Source: LSEG Lipper
Both the UK and the Eurozone exited technical recessions with growth in Q1 (though flatlining for the UK in April—although this wasn’t released until June), as Japan went the other way, with negative growth for the quarter. Its equity market underperformed the global, although investors still committed £469m, £397m of this to trackers. While Equity Europe ex UK attracted £713m, Equity UK continues its pariah status with a vengeance (see Chart 5).
Equity Global topped chart 4, taking in £2.79bn. Active funds took the majority, at £1.67bn. About half of the total went to new fund launch, JPM Global Focus Fund S – Net Income – a new launch (see table below).
Source: LSEG Lipper
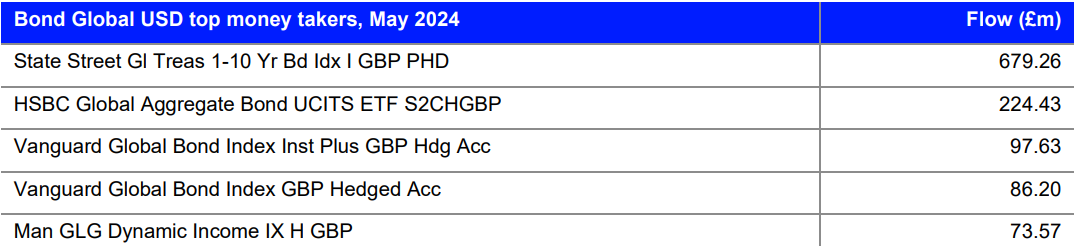
In fixed income terms, most govvies were down over the month and year to date. However, Bond GBP Government and Bond USD Government both saw strong inflows of £1.04bn and £431m, respectively. Bond Global USD, which has a strong exposure to govvies, was the second biggest money-taker, at £1.42bn, and the top seller in the classification (£679m) is solely government bonds.
Source: LSEG Lipper
While Equity US moved down the rankings from last month, these funds took in a respectable £609m as technology contributed more than half of the US index’s returns, while staples and industrials detracted. We’ve previously noted that allocation to the US are bucking the trend to passive, and May continued this pattern, as active strategies took £1.19bn, while passives shed £579m.
Largest Outflows
Chart 5: Largest Outflows by LSEG Lipper Global Classification, May 2024 (£bn)

Source: LSEG Lipper
The FTSE 100 lagged global equities, followed by Developed Asia Pacific, as Equity Asia Pacific ex Japan saw outflows of £445m. Equity UK saw the highest outflows (-£3.12bn)—double that of the next on the table, Money Market GBP (-£1.55bn). Over the past 12 months, the classification has suffered outflows of £18.22bn, and this is one of the biggest monthly losses.
Equity UK Income also saw significant redemptions, of £559m. While UK mid-caps outperformed the FTSE All-World over the month, there was little appetite for these funds, and Equity UK Sm&Mid Cap saw outflows of £8m. UK equity managers have long talked up the cheapness of the market, but one has to wonder how cheap it needs to get before investors are tempted back.
While equity-heavy mixed asset funds continue to thrive (see above), there balanced and cautious equivalents go further into the red, seeing redemptions of £910m and £144m, respectively, over the month.
Euro and EM high yield outperformed their investment grade counterparts, with EM HY showing particularly strong performance YTD, while US investment grade fared better than its high yield counterpart, according to FTSE Russell analysis. Despite this, we see little appetite for HY, and Bond Global High Yield GBP suffered significant outflows of £266m.
Sustainable Fund Flows
Chart 6: Sustainable Asset Class Flows, May 2024 (£bn)

Source: LSEG Lipper
Recovering from a poor April, sustainable funds ex-MMF took £757m, while their conventional peers netted £621m. Reversing the previous month’s outflows, sustainable equity funds were the main beneficiaries, attracting £679m, as their conventional peers saw outflows of £526m—spread, as the table below suggests, mainly between Equity Global and Equity US funds.

Source: LSEG Lipper
On the other hand, sustainable bond flows were only 5% of their conventional peers, taking £114m for the month, with the largest allocations going to Bond Global Corporates and Bond Emerging Markets Global Hard Currency funds.

Source: LSEG Lipper
The Sustainable Fund Flows section has a narrower and stricter focus than those which indicate some form of ESG strategy in their fund documentation—to a smaller group of sustainable funds, defined as all SFDR article 9 funds plus all Lipper Responsible Investment Attribute funds reduced to those containing indicative sustainable keywords in the fund name.
Flows by Promoter
Chart 7: Largest Positive Flows by Promoter, May 2024 (£bn)
Source: LSEG Lipper
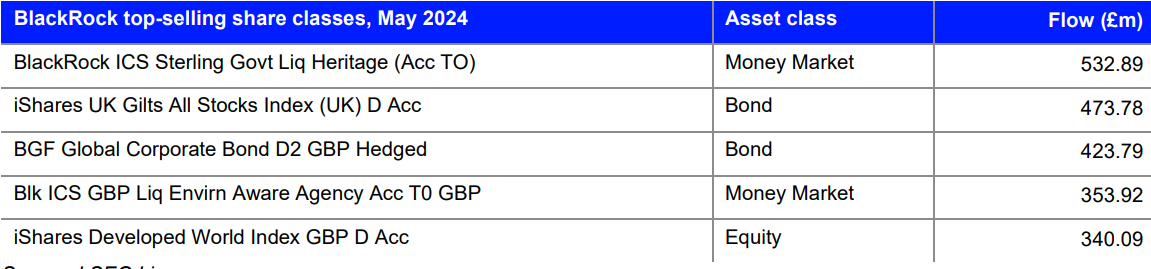
BlackRock was May’s top money-taker, netting £4.59bn, followed by State Street Global Advisors (£916m) and Northern Trust (£854). BlackRock led with bond (£2.24bn), followed by equity (£1.54bn) and MMF (£736m).
Source: LSEG Lipper
Meanwhile, State Street’s flows were dominated by allocations to bond funds, at £819m.
Source: LSEG Lipper