The performance of the underlying markets led, in combination with the estimated net flows, to increasing assets under management in the global ETF industry (from $11,913.2 bn as of April 30, 2024, to $12,460.1 bn at the end of May). At a closer look, the increase in assets under management of $546.8 bn for May was driven by the performance of the underlying markets (+$422.5 bn), while the estimated net inflows contributed (+$124.2 bn) to the growth of the assets under management. Looking at the different product types, the promoters of ETFs (+$125.1 bn) enjoyed inflows, while the promoters of structured notes (-$0.9 bn) faced outflows over the course of May 2024.
That said, a more detailed view on the estimated net flows by region shows that the fund flows trend were consistent for all regions as table 1 shows. Nevertheless, some ETF domiciles faced outflows over the course of May 2024.
Table 1: General Overview on Global Assets Under Management and Estimated Fund Flows by Regions and Major ETF Domiciles (May 31, 2024)

Source: LSEG Lipper
Assets Under Management
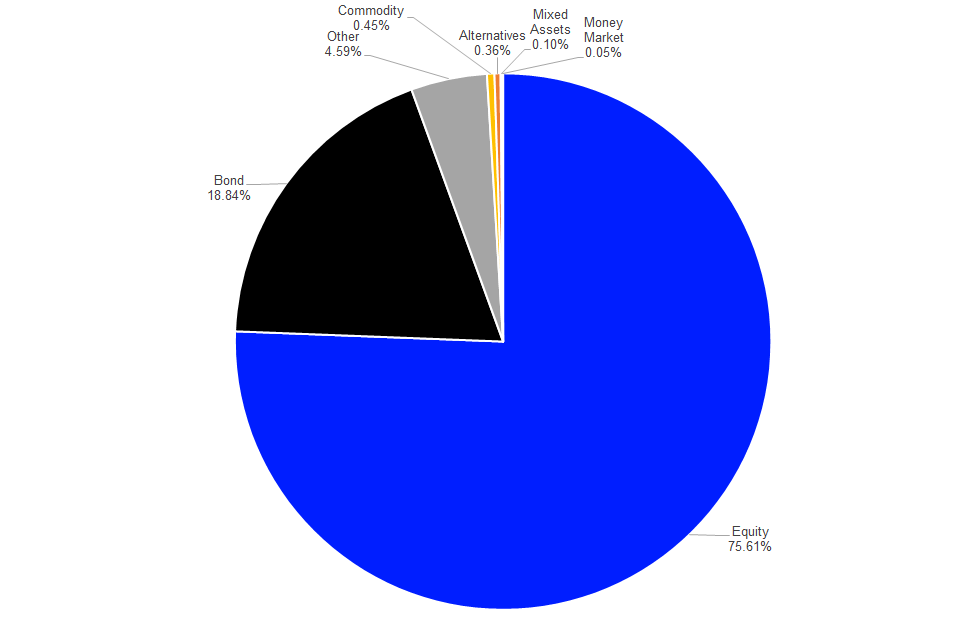
Assets under management in the global ETF industry increased from $11,913.2 bn as of April 30, 2024, to $12,460.1 bn at the end of May 2024. The majority of these assets ($9,715.2 bn) were held in equity ETFs. This category was followed by bond ETFs ($2,213.8 bn), commodities ETFs ($198.4 bn), alternatives ETFs ($130.2 bn), ”other” ETFs ($94.3 bn), money market ETFs (€65.0 bn), mixed-assets ETFs ($43.2 bn), and real estate ETFs (€0.02 bn).
Graph 1: Market Share Assets Under Management in the Global ETF Industry by Asset Type – May 31, 2024

Source: LSEG Lipper
Since this report covers a limited number of ETNs and ETCs, the so-called “structured notes” alongside ETFs, it is important to show the market share of assets under management of these products in comparison to ETFs to indicate the relevance and possible impact of these products for this study.
While ETFs held $12,181.5 bn, or 97.76%, of the overall assets under management, the structured notes covered in this report held $278.6 bn, or 2.24%, of the overall assets under management covered in this report at the end of May 2024.
Graph 2: Market Share Assets Under Management in the Global ETF Industry by Product Type – May 31, 2024
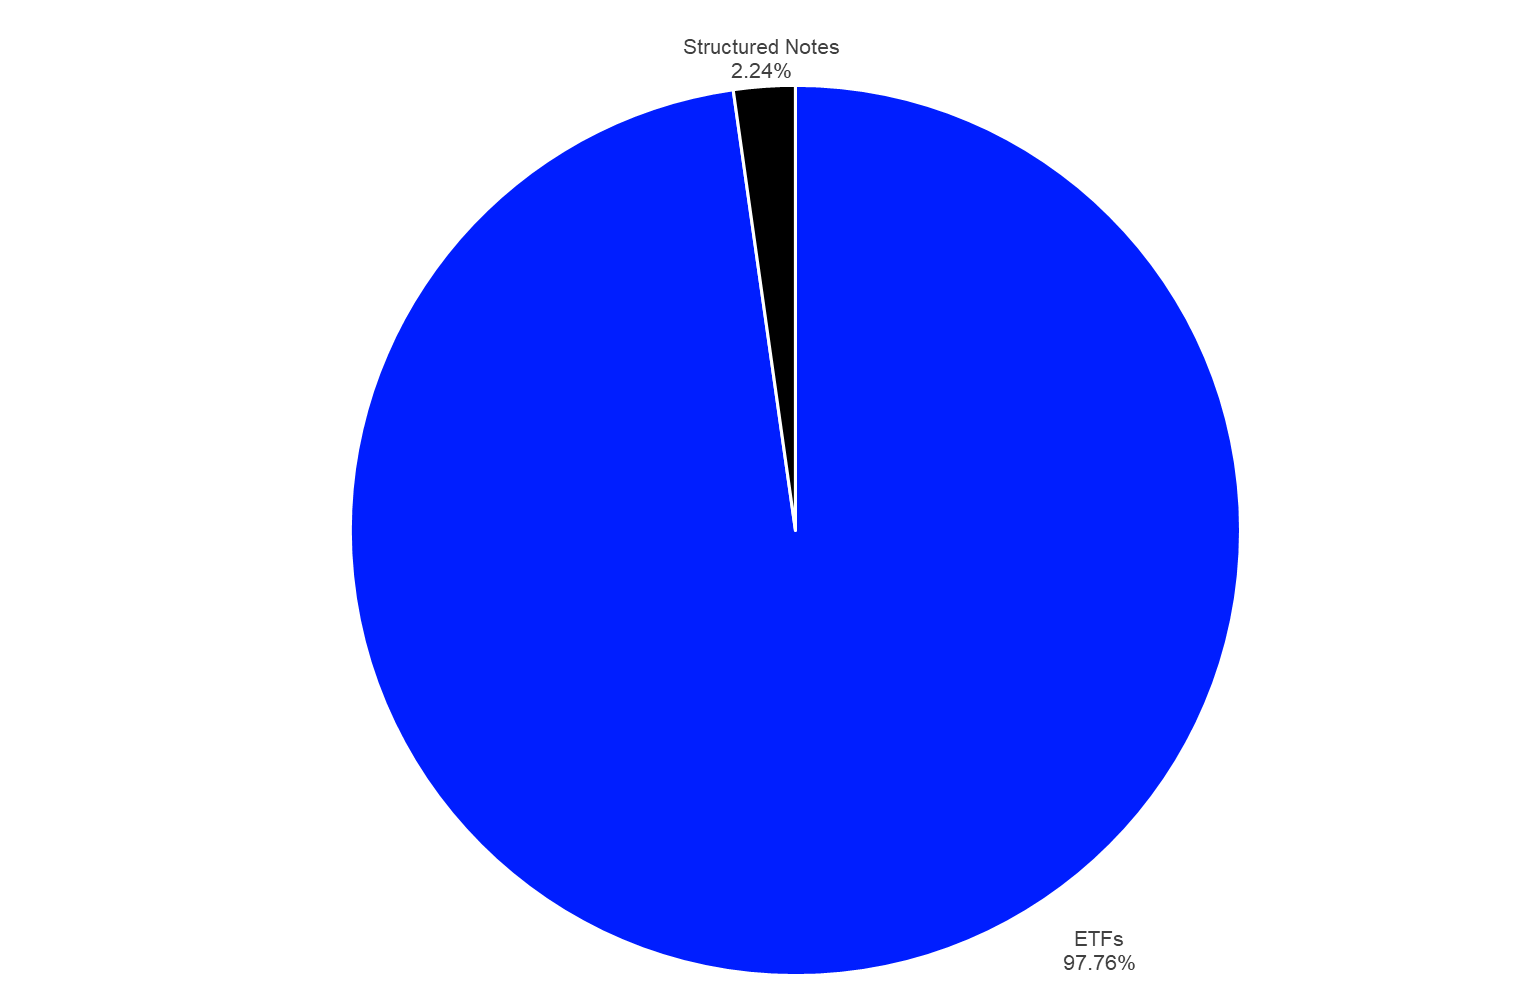
Source: LSEG Lipper
Since ETFs are product wrappers which are used for passive index tracking products and active/semi-active strategies, it is important to shed a light on these two different product categories. Market observers expect more growth in the segment of active/semi-active products in the future since an increasing number of active managers are starting to launch ETFs not linked to an index or ETF share classes of existing actively managed mutual funds. It is expected that this trend will continue since the patent on ETF share classes held by Vanguard expired in April 2023.
Nevertheless, it is no surprise that index tracking products held the vast majority of the overall assets under management in the global ETF industry ($11,655.0 bn or 93.54%), while ETFs which aim to outperform an index or are not linked to an index at all held $805.1bn, or 6.46%, of the overall assets under management at the end of May 2024.
Graph 3: Market Share Assets Under Management in the Global ETF Industry by Management Approach – May 31, 2024

Source: LSEG Lipper
Assets Under Management Factor-Based ETFs
Since products which follow a factor-based strategy—the so-called smart beta products—can be found under both product types, it makes sense to highlight the high overall market share of factor-based products. Overall, factor-based products held assets under management of $2,517.5 bn at the end of May, which means in turn these products had an overall market share of 20.20%. The high percentage of the assets under management in factor-based ETFs shows that these products, which have been seen as marketing-driven product launches in the past, have become mainstream investments over time.
Graph 4: Market Share Assets Under Management in the Global ETF Industry Factor-Based ETFs vs Conventional ETFs – May 31, 2024
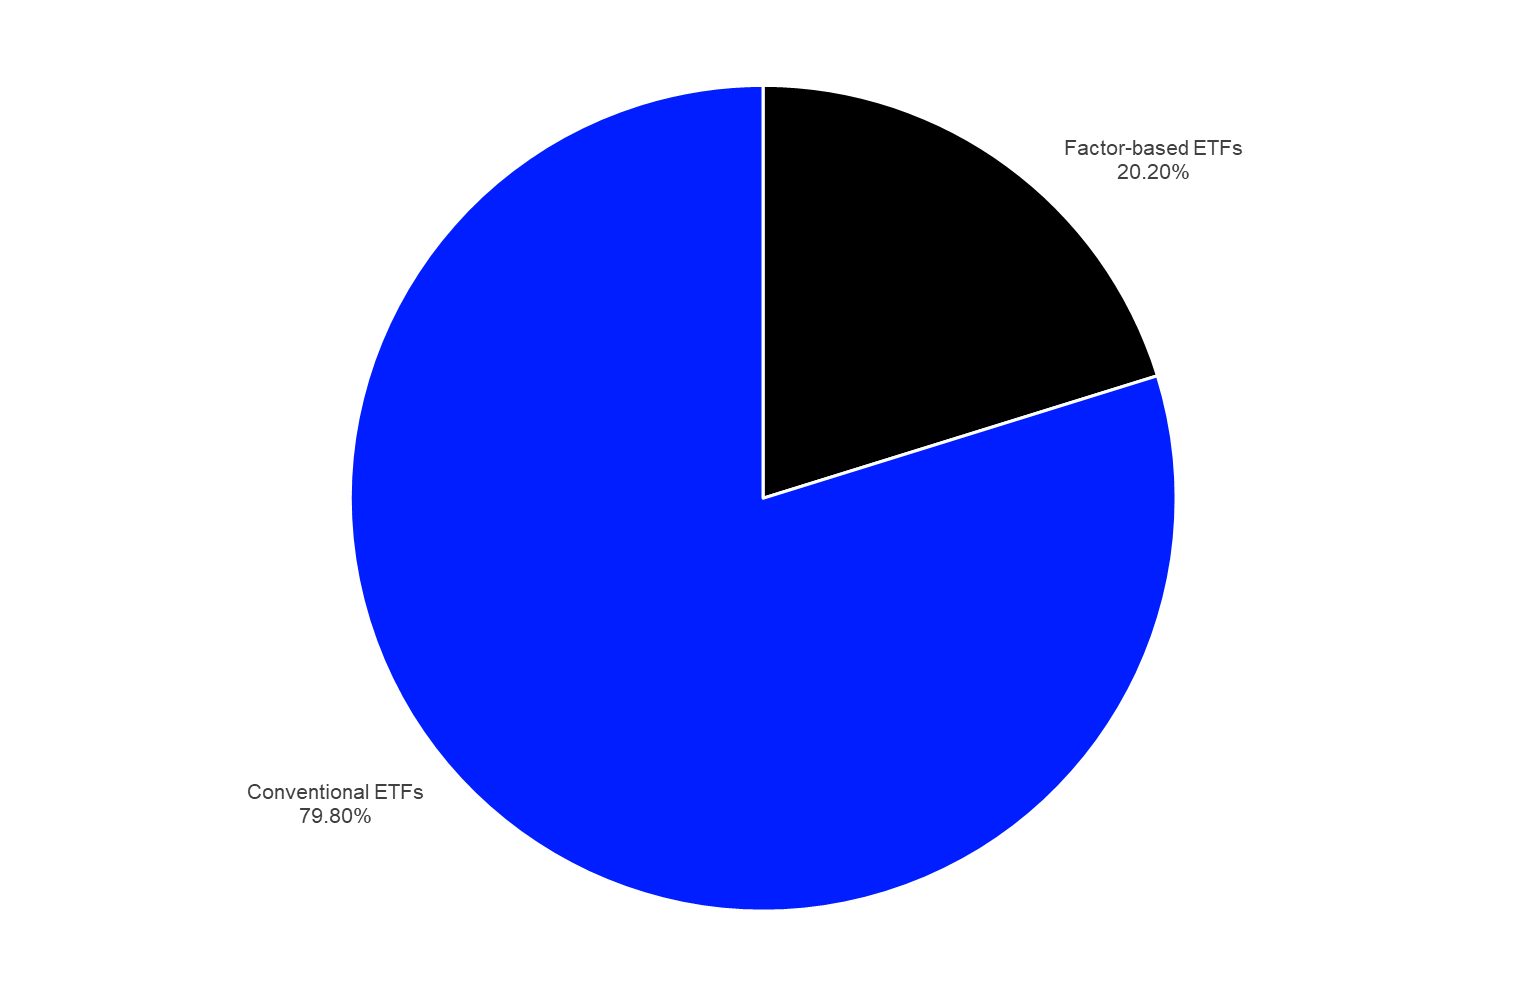
Source: LSEG Lipper
It is actually no surprise that investors around the globe use factor-based ETFs within their portfolios since these products offer access to a broad range of factors which have proven that they can be exploited to deliver additional returns for investors over longer time periods. Nevertheless, the potential outperformance of a given factor is often dependent on the right timing of the investment since single factors do not deliver a consistent outperformance. With regard to this, it is no surprise that the global ETF industry developed products which use multiple factors. These products shall be easier to use for investors since the usage of multiple factors shall remove the need for market timing.
The graph below shows the variety of factor strategies which are available to investors.
As multifactor ETFs are convenient products, it is no surprise that these products held the highest assets under management in the segment of factor-based ETFs ($994.1 bn). They are followed by ETFs using dividends as a selection factor ($414.8 bn), ETFs using the growth factor ($282.4 bn), size factor ETFs ($277.1 bn), and ETFs using the value factor ($262.5 bn).
Graph 5: Market Share Assets Under Management of Single Factors within the Factor-based ETF Universe – May 31, 2024
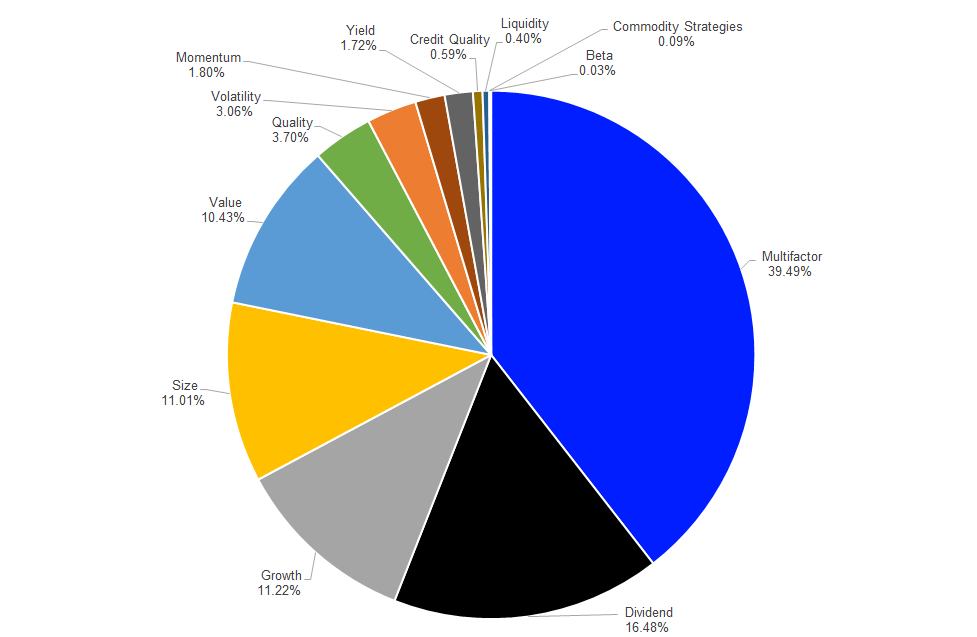
Source: LSEG Lipper
Assets Under Management ESG-Related ETFs
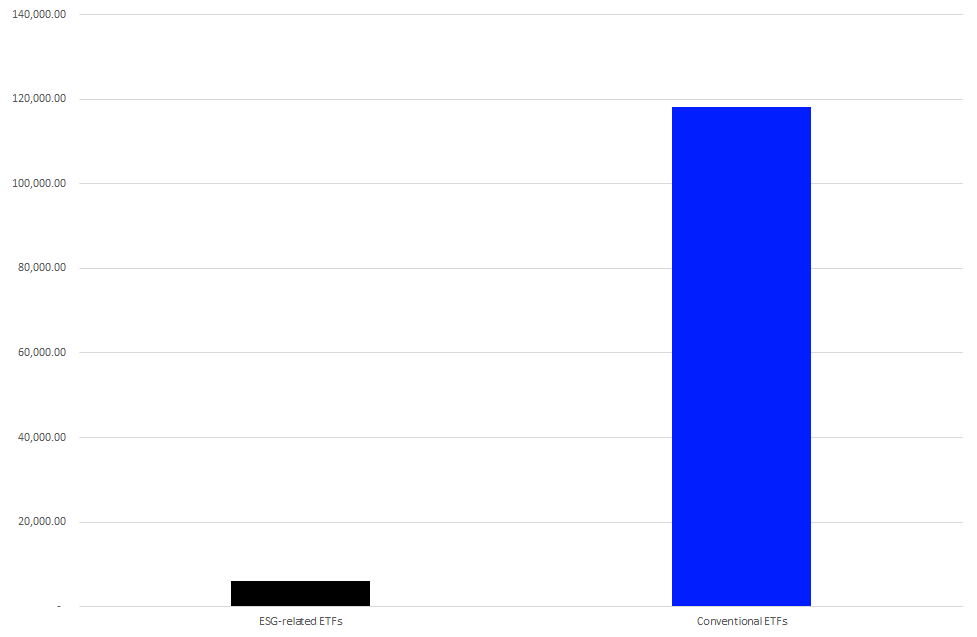
Since sustainable investing is one of the major topics for investors around the globe, it is no surprise that the global ETF industry offers sustainable products. That said, the products available use different strategies and sustainable investment credentials. With regard to this, it is noteworthy that not all ETFs which have implemented some kind of sustainable investment credentials can be seen as sustainable or ESG products. Nevertheless, this statistic marks all ETFs which state the use of at least one ESG-related credential to determine the constituents of its index as ESG-related, while ETFs which do not use any sustainable investment credentials are marked as conventional ETFs.
Given the fact that most portfolios are still benchmarked against conventional indices, it is not surprising that conventional ETFs ($11,852.5 bn) held the vast majority of the assets under management in the global ETF industry while their ESG-related peers held $634.6 bn in assets under management at the end of May 2024.
Graph 6: Market Share Assets Under Management in the Global ETF Industry ESG-Related ETFs vs Conventional ETFs – May 31, 2024

Source: LSEG Lipper
Since there are currently a lot of regulatory initiatives underway to tackle “greenwashing,” especially with regard to the alignment of fund names with the actual fund strategy and the respective usage of ESG credentials within the securities selection process, we might witness a lot of change with regard to the usage of ESG credentials in fund names or the fund related literature. As a consequence, these changes might lead to significantly lower assets under management in ESG-related funds over the course of the next few months, since fund and ETF promoters want to avoid being accused practicing greenwashing.
Given the overall market structure of the global ETF industry it is no surprise that equity ETFs ($479.8 bn) held the highest assets under management in the segment of ESG-related ETFs. They were followed by bond ETFs ($119.6 bn), “other” ETFs ($29.1 bn), commodities ETFs ($2.9 bn), alternatives ETFs ($2.3 bn), mixed-assets ETFs ($0.6 bn), and money market ETFs ($0.3 bn).
Graph 7: Market Share Assets Under Management of ESG-Related ETFs by Asset Type – May 31, 2024
Source: LSEG Lipper
Assets Under Management by Region
ETFs domiciled in North America ($9,357.9 bn) held the highest assets under management in the global ETF industry at the end of May 2024. They were followed by ETFs domiciled in Europe ($1,977.9 bn), ETFs domiciled in the Asia Pacific region ($1,098.2 bn), ETFs domiciled in South and Central America ($17.5 bn), and ETFs domiciled in Africa ($8.6 bn).
Graph 8: Assets Under Management in the Global ETF Industry by Region – May 31, 2024 (in mn USD)

Source: LSEG Lipper
In more detail, the U.S. was the largest single country ETF domicile ($9,016.5 bn) at the end of May 2024, followed by Ireland ($1,407.7 bn), Japan ($562.2 bn), Luxembourg ($355.1 bn), and Canada ($341.2 bn). These five ETF domiciles account for assets under management of $11,683.0 bn, or 93.76%, of the overall assets under management in the global ETF industry.
Assets Under Management by Lipper Global Classification
Equity U.S. held by far the highest assets under management ($4,253.3 bn) of the 282 Lipper Global Classifications covered in this report. It was followed by Equity U.S. Small & Mid Cap ($787.5 bn), Equity Global ex-U.S. ($726.8 bn), Equity Japan ($603.4 bn), and Equity Global ($465.4 bn).
Graph 9: The 20 Largest Lipper Global Classifications by Assets Under Management – May 31, 2024 (in mn USD)

Source: LSEG Lipper
A closer review of the assets under management by Lipper Global Classification shows that the 10 largest classifications held $8,552.0 bn, or 68.64%, of the overall assets under management of the global ETF industry, while the largest 20 classifications account for $9,972.5 bn, or 80.04%, of the overall assets under management at the end of May 2024.
Assets Under Management by Promoters
BlackRock (iShares) is the largest promoter of ETFs globally ($3,840.8 bn). It is followed by Vanguard ($2,836.0 bn), State Street Global Advisors (SPDR) ($1,405.1 bn), Invesco ($627.2 bn), and Charles Schwab Investment Management ($345.5 bn).
Graph 10: Assets Under Management of the 20 Largest ETF Promoters Globally – May 31, 2024 (in mn USD)

Source: LSEG Lipper
As graph 10 shows, the assets under management in the global ETF industry are even more highly concentrated at the promoter level than at the domicile or classification level.
The three top ETF promoters globally account for assets under management of $8,082.0 bn, or 64.86%, of the overall assets under management, while the 10 top promoters account for $10,140.7 bn, or 81.39%, of the overall assets under management and the 20 top promoters account for $11,119.1 bn, or 89.24%, of the assets under management held by ETFs globally.
Global ETF Flows
The global ETF industry enjoyed healthy overall inflows of $124.2 bn over the course of May 2024. These flows drove the overall inflows in the global ETF industry up to $518.5 bn for 2024 overall.
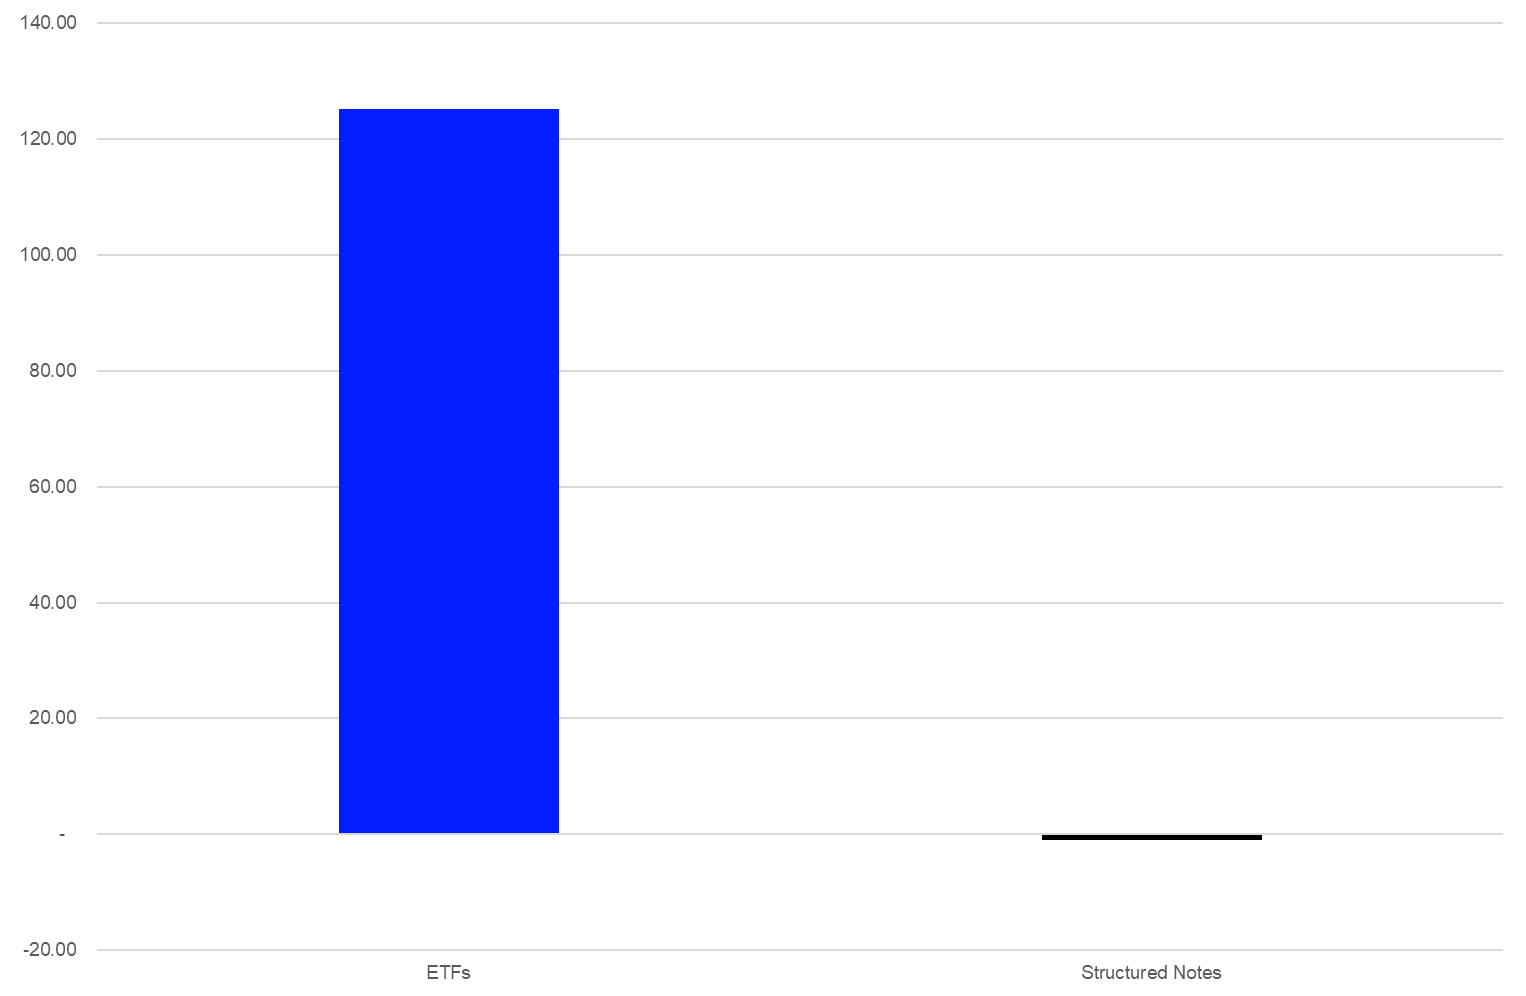
As mentioned before, this report covers a limited number of structured notes alongside ETFs. It is important to split the overall estimated fund flows between these two product types to indicate the relevance and possible impact of structured notes for this study.
ETFs enjoyed estimated net inflows of $125.1 bn over the course of May, while structured notes faced estimated net outflows (-$0.9 bn) over the same time period.
Graph 11: Estimated Net Sales by Product Type, May 1, 2024 – May 31, 2024 (in mn USD)
Source: LSEG Lipper
As mentioned before, ETFs can be managed with different approaches. They may use a passive approach (index tracking) where the portfolio of the respective ETF is tied to an index, or an active/semi-active approach where the fund manager has the aim to outperform an index or is not linked to an index at all.
Index tracking products enjoyed the vast majority of the estimated net inflows (+$100.9 bn) over the course of the month, while active/semi-active products enjoyed estimated net inflows of $23.3 bn over the same time period.
Graph 12: Estimated Net Sales by Management Approach, May 1, 2024 – May 31, 2024 (in mn USD)

Source: LSEG Lipper
These flow numbers show that there is a trend toward active/semi-active ETFs since the market share of the overall estimated net flows of these products is much higher than their market share of the assets under management. This means active/semi-active products grow faster than the overall ETF industry and will therefore grow their market share relative to other ETF categories.
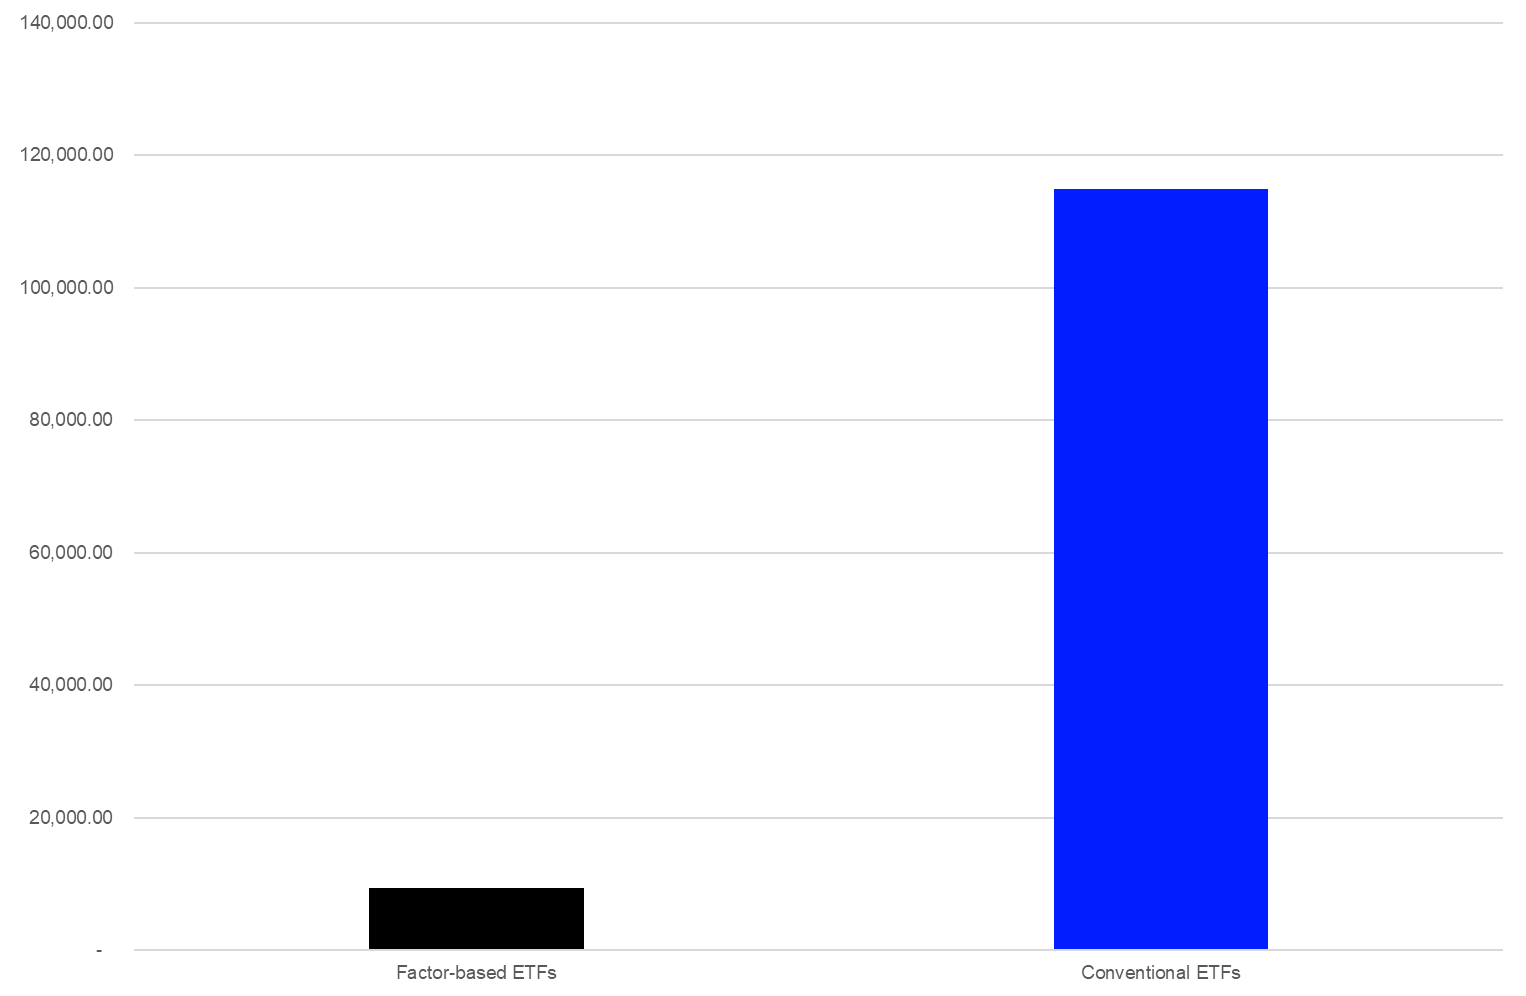
Global ETF Flows in Factor-Based ETFs
Since products which follow a factor-based strategy held a high overall market share of the assets under management in the global ETF industry, it makes sense to review the estimated net flows for these products. Especially as some market observers have already stated that active/semi-active ETFs may displace factor-based ETFs in the near future. That said, this statement can’t be proofed by fund flow numbers since factor-based products enjoyed inflows of $9.4 bn over the course of May, while their conventional peers posted inflows of $114.9 bn.
Nevertheless, compared to the overall estimated net inflows into ETFs globally the market share of factor-based ETFs from the overall ETF flows (7.54%) is lower than their market share of assets under management (20.20%).
Graph 13: Estimated Net Flows in the Global ETF Industry Factor-Based ETFs vs Conventional ETFs – May 1, 2024 – May 31, 2024 (in mn USD)
Source: LSEG Lipper
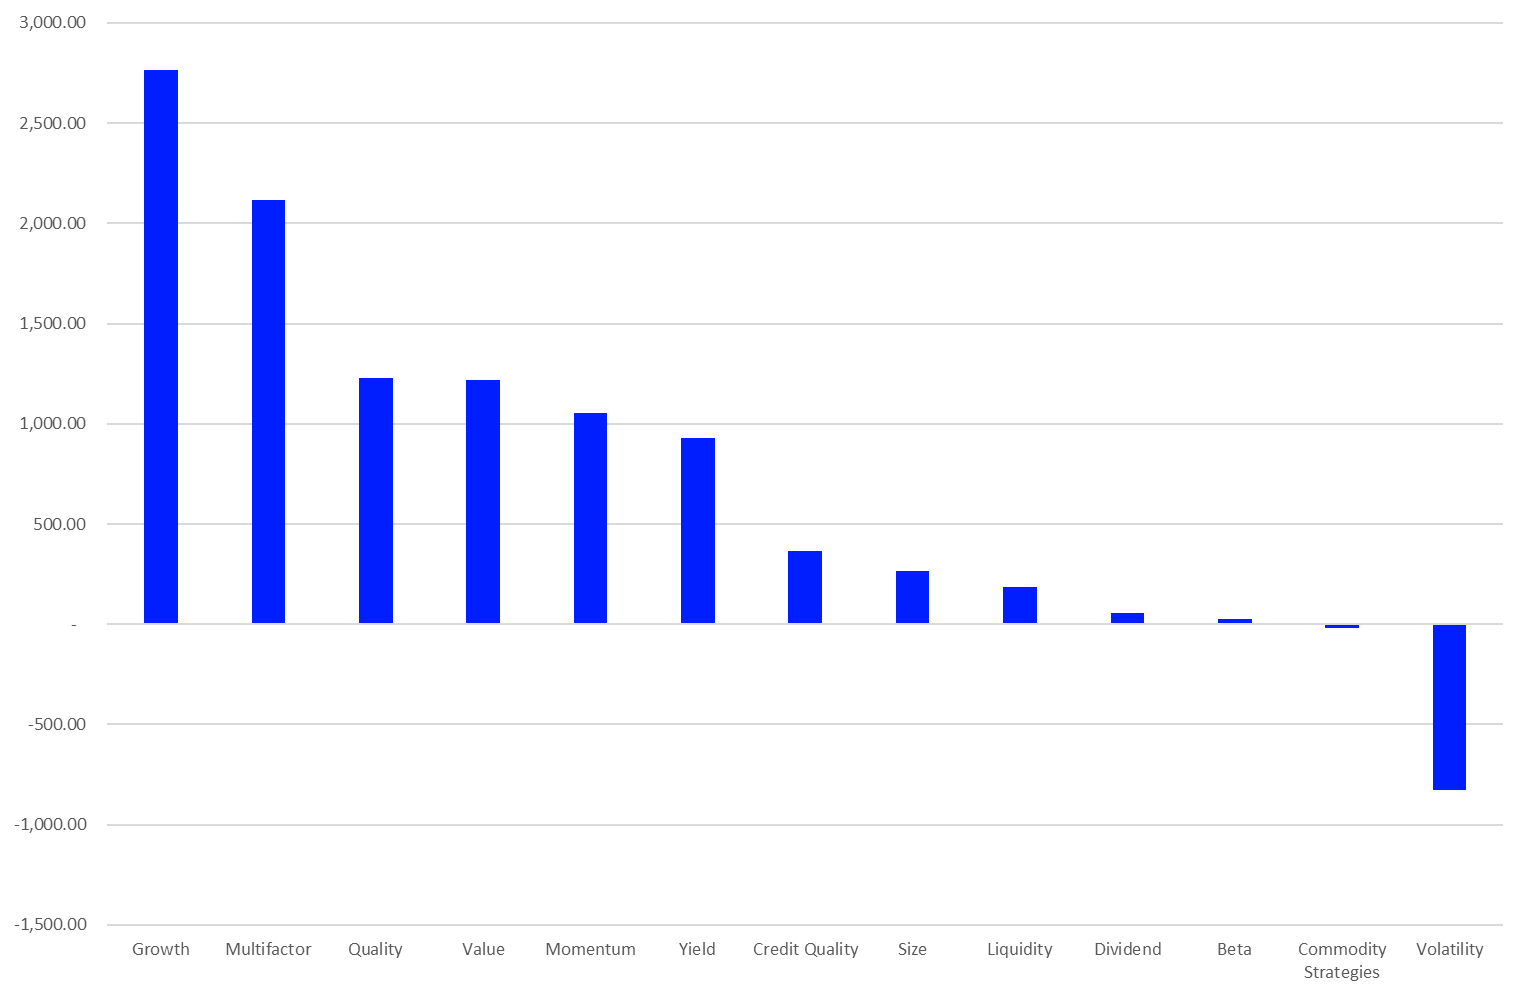
Growth was the best-selling factor within the segment of factor-based ETFs (+$2.8 bn). They are followed by ETFs using a multifactor approach (+$2.1 bn), ETFs using the quality factor (+$1.2 bn), value factor ETFs (+$1.2 bn), and ETFs using the momentum factor (+$1.1 bn).
Graph 14: Estimated Net Flows of Single Factors Within the Segment of Factor-Based ETFs – May 1, 2024 – May 31, 2024 (in mn USD)
Source: LSEG Lipper
On the other side of the fund flows league table for factor-based ETFs using the volatility factor (-$0.8 bn) were facing the highest outflows. The category was bettered by commodities strategies ETFs (-$0.02 bn).
Global ETF Flows in ESG-Related ETFs
Given the fact that sustainable investing is a hot topic in the global investment industry, it is not surprising that ESG-related ETFs enjoyed estimated net inflows (+$6.1 bn) over the course of May despite the still ongoing discussions about greenwashing and the regulatory headwinds in some jurisdictions.
Graph 15: Estimated Net Flows in the Global ETF Industry ESG-related ETFs vs Conventional ETFs – May 1, 2024 – May 31, 2024 (in mn USD)
Source: LSEG Lipper
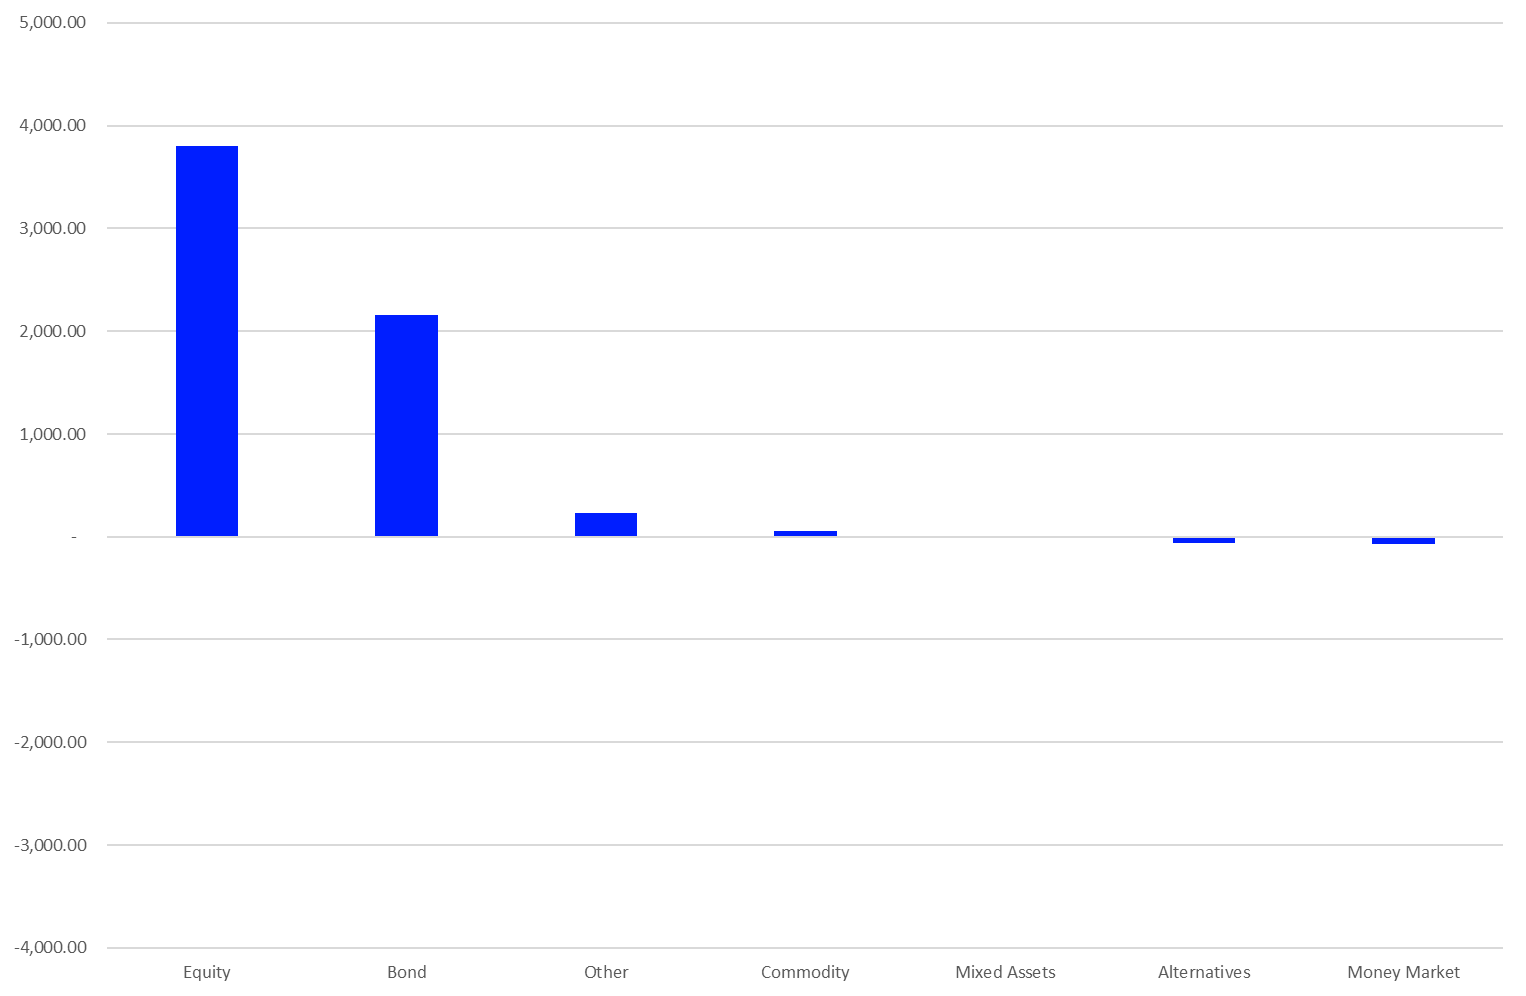
With regard to the overall market structure and the general fund flow trend, it is somewhat surprising that equity ETFs (+$3.8 bn) enjoyed the highest estimated net inflows in the segment of ESG-related ETFs for May. They were followed by bond ETFs (+$2.2 bn), “other” ETFs (+$0.2 bn), commodities ETFs (+$0.1 bn), and mixed-assets ETFs (+$0.01 bn). Meanwhile, alternatives ETFs (-$0.1 bn) and money market ETFs (-$0.1 bn) were the asset types facing outflows in the segment of ESG-related ETFs.
Graph 16: Estimated Net Flows of ESG-related ETFs by Asset Type – May 1, 2024 – May 31, 2024 (in mn USD)
Source: LSEG Lipper
Global ETF Flows by Region
By reviewing the estimated flows in the global ETF industry by fund domicile and the respective regions, one needs to bear in mind that some domiciles have specific advantages or disadvantages when it comes to ETF distribution. The U.S. is, for example, a single market and can take profit from the size of the overall market, while in Europe every market is or at least can be an ETF domicile, which means that the local markets are much smaller. That said, the EU countries have established a fund regulation (Undertakings in Collective Investments and Transferable Securities, or UCITS) which enables the fund and ETF industry to cross-list all products which are registered for sale in one EU country into another EU country. Since UCITS has become such a well-recognized regulation standard for mutual funds and ETFs, some countries in South and Central America, as well in Asia, allow UCITS funds to be cross-listed and sold to local investors. It is fair to say that there is no other regulatory framework available that allows funds to be distributed in various countries around the globe. Other mutual recognition agreements, such as those between Hong Kong and China or Hong Kong and Taiwan, are only bilateral and have no global reach. This means that the estimated flows for European ETFs may also include flows from South and Central America, as well as from Asia.
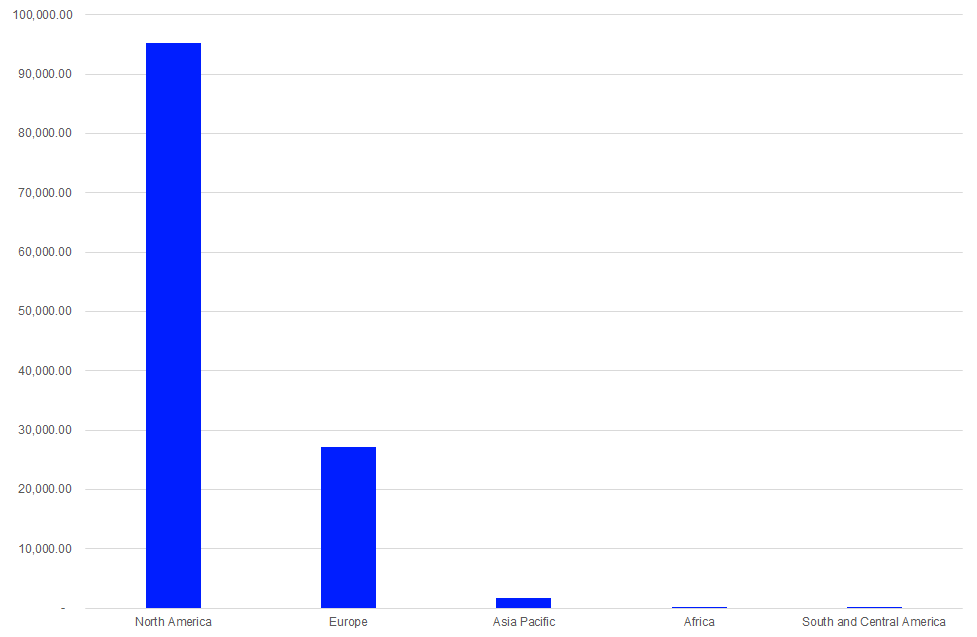
As to be expected, ETFs domiciled in North America (+$95.2 bn) enjoyed the highest estimated net inflows for May 2024. They were followed by ETFs domiciled in Europe (+$27.2 bn), Asia Pacific (+$1.7 bn), (South) Africa (+$0.1 bn), and South and Central America (+$0.03 bn).
Graph 17: Estimated Net Flows in the Global ETF Industry by Region, May 1, 2024 – May 31, 2024 (in mn USD)
Source: LSEG Lipper
In more detail, the U.S. (+$91.4 bn) was the single fund domicile with the highest estimated net inflows for May. It was followed by Ireland (+$22.5 bn) and Luxembourg (+$6.0 bn).
Global ETF Flows by Asset Type
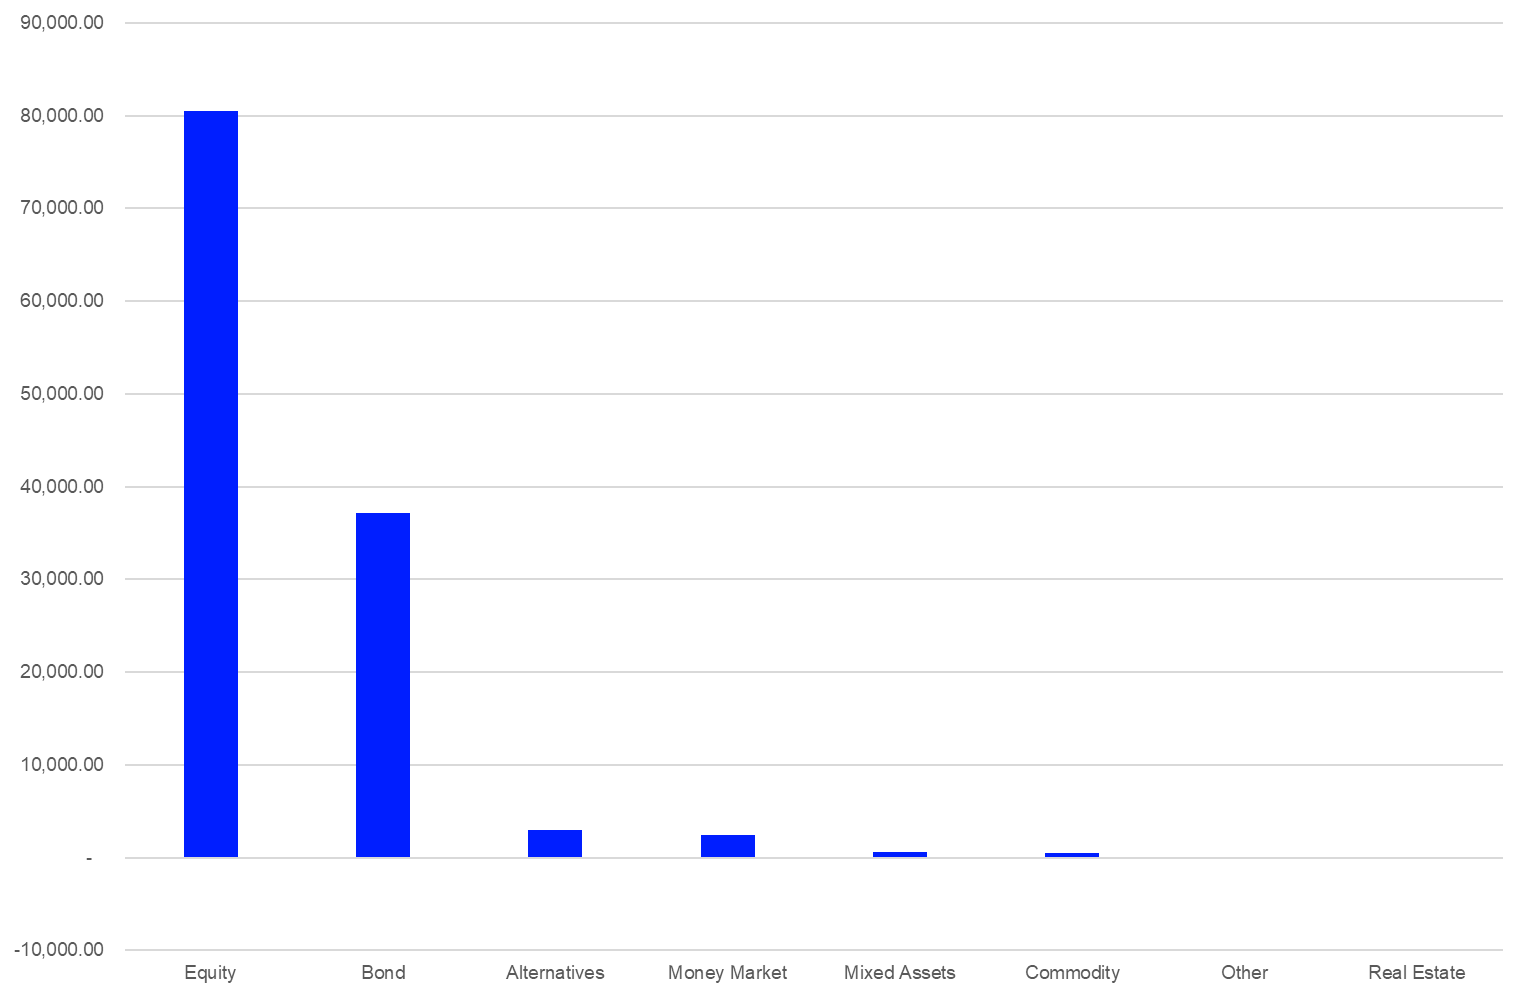
Given the overall market environment, it was not surprising that equity ETFs (+$80.5 bn) were the best-selling asset type for May 2024. They were followed by bond ETFs (+$37.2 bn), alternatives ETFs (+$3.0 bn), money market ETFs (+$2.5 bn), mixed-assets ETFs (+$0.6 bn), commodities ETFs (+$0.5 bn), and “other” ETFs (-$0.1 bn). On the other side of the table, real estate ETFs (-$0.001 bn) was the only asset type which faced outflows for the month.
Graph 18: Estimated Net Sales by Asset Type, May 1, 2024 – May 31, 2024 (in mn USD)
Source: LSEG Lipper
The fact that equities were the best-selling asset type for the month might be a sign that investors have returned to risk-on mode with regard to their risk appetite. In addition, the strong inflows into bond ETFs might be seen as a sign that investors may anticipate a possible ending of the interest hiking cycle of central banks around the globe led by the European Central Bank and the U.S. Federal Reserve. Therefore, this positioning might be seen as a bet that inflation will go down further despite some still hawkish statements made by central bankers in the EU and the U.S.
Global ETF Flows by Lipper Global Classifications
A closer look at the best and worst Lipper Global Classifications by estimated net flows for May shows that investors are still somewhat in risk-on mode with regard to their risk appetite. This is because the table of the 10 best-selling Lipper Global Classifications is composed of five bond, four equity, and one alternatives classifications. Equity U.S. (+$58.2 bn) was the best-selling classification for the month. The category was followed by Equity Global (+$8.5 bn), Bond USD Medium Term (+$5.8 bn), Bond USD Government (+$5.1 bn), and Equity Global ex US (+$5.1 bn).
Graph 19: Ten Best- and Worst Lipper Global Classifications by Estimated Net Sales, May 1, 2024 – May 31, 2024 (in mn USD)

Source: LSEG Lipper
On the other side of the table, Equity Japan (-$6.8 bn) again faced the highest outflows. It was bettered by Alternative Equity Leveraged (-$4.2 bn), Equity Sector Energy (-$2.3 bn), Equity Theme – Natural Resources (-$1.9 bn), and Equity Sector Healthcare (-$1.1 bn).
More generally, the flow trends for the classifications with the highest estimated outflows may indicate that investors adjusting their portfolios to the current economic environment and are reducing non-core asset classes, especially sector and themed products, within their portfolios.
Given that Alternative Currency Strategies (+$1.6 bn) enjoyed only relatively low inflows might be a sign that the investor interest in spot Bitcoin ETFs has decreased after the hype in the first two months after these products have been approved in the U.S., as these ETFs are classified as Alternative Currency Strategies in the Lipper database.
Global ETF Flows by Promoters
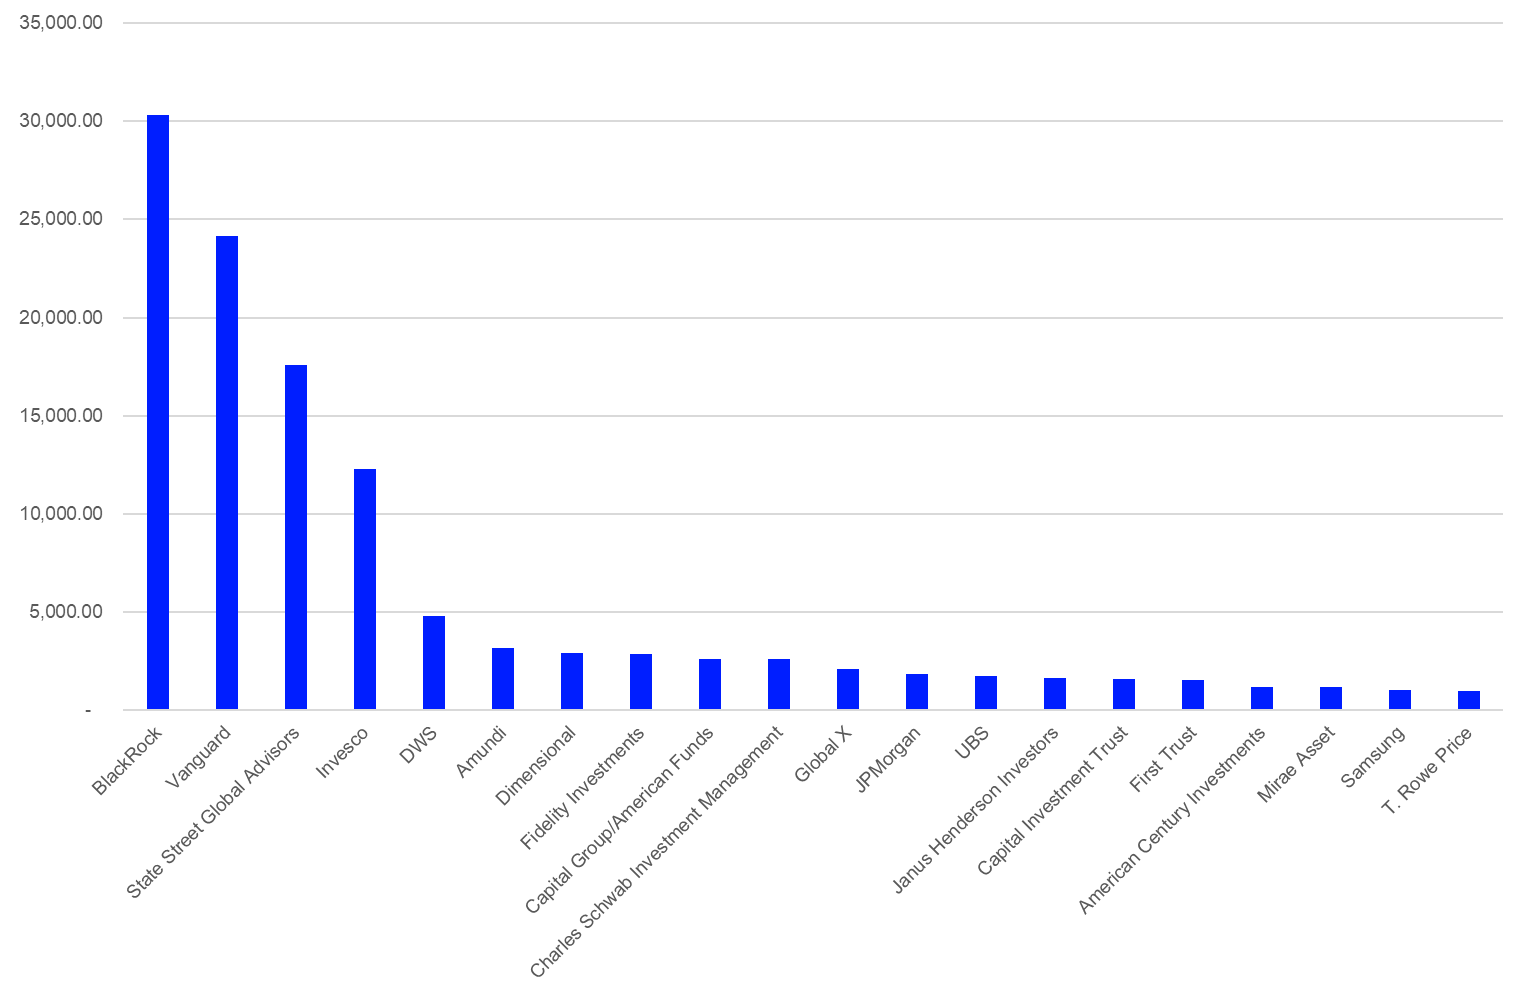
BlackRock (+$30.3 bn) was the best-selling ETF promoter globally for the month, ahead of Vanguard (+$24.2 bn), State Street Global Advisors (+$17.6 bn), Invesco (+12.3 bn), and DWS (+4.8 bn).
Graph 20: Twenty Best-Selling ETF Promoters Globally, May 1, 2024 – May 31, 2024 (in mn USD)
Source: LSEG Lipper
Overall, the 20 best-selling ETF promoters account for estimated net inflows of $118.2 bn..
This article is for information purposes only and does not constitute any investment advice.
The views expressed are the views of the author, not necessarily those of Lipper or LSEG.

