

Key Takeaways:
- Affordability challenges, including high upfront costs and rising rents, are dampening renter demand in NYC.
- Due to low vacancy rates, the Manhattan rental market is in a holding pattern with steady asking rents and concessions.
- New developments are driving rental inventory growth in NYC, with the Bronx leading the city in both affordable and market-rate rental supply.
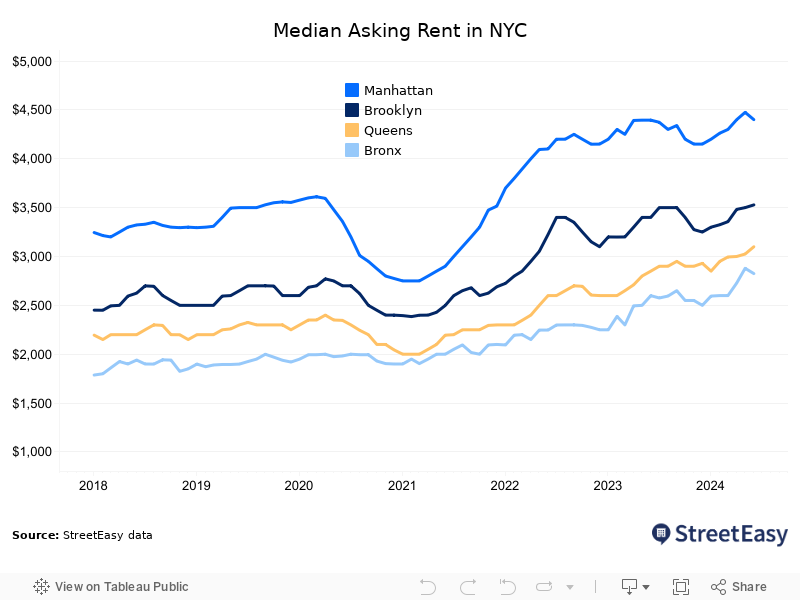
The median asking rent in New York City was $3,800 in June, 1.3% higher than a year ago. However, the citywide median asking rent remained flat from May to June, even though rents tend to rise in the summer as New Yorkers look for new homes before their leases lapse.
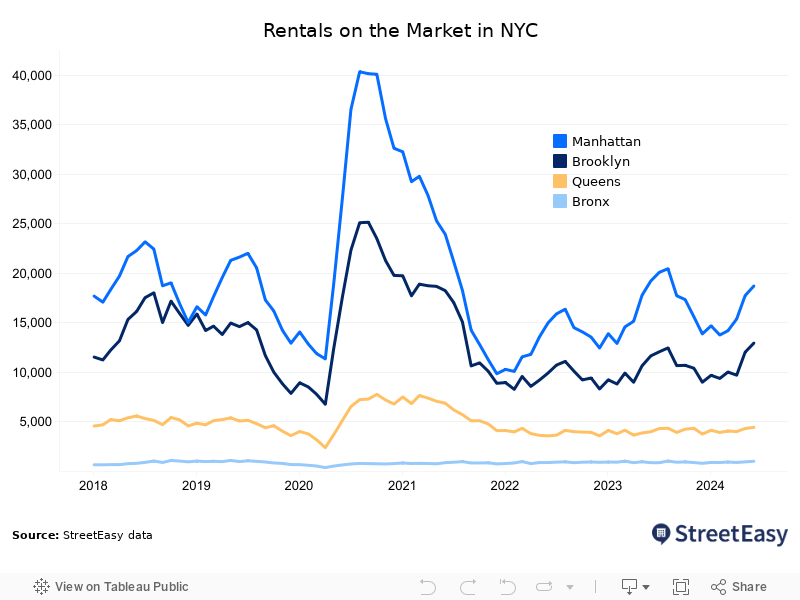
Gradually rising inventory is easing competition in the city’s overall rental market, and contributing to the recent slowdown in rent growth. In June, there were 37,196 rentals on the market across NYC, up 3.7% from a year ago.
Soaring rents and upfront costs, however, have made it more challenging to afford a rental in NYC. New Yorkers earning the city’s average annual wage could afford less than 5% of rentals in 2023. Even tech workers, whose wages are higher than average, could afford about one in three rentals in the city. These affordability challenges are weighing on overall renter demand.
Meanwhile, few vacancies in the city’s rental buildings are keeping a floor on asking rents and a ceiling on rental inventory. In addition to elevated rents, high upfront costs in NYC have been incentivizing renters to defer their next move. Based on the average upfront cost of $10,454 per StreetEasy data, a renter earning the median household income in NYC — $74,694 according to the 2022 American Community Survey (ACS) — would have to spend 14% of their annual income to cover the expenses required to sign a new lease. This is a substantial barrier to mobility that keeps vacancies low.
Though rental inventory is up 3.7% year-over-year, with affordability challenges leading to more renters staying put, fewer homes have become available on the NYC market over the last five years. Compared to 2019, there were 20.4% fewer rentals on the market in the first half of 2024. The shortage is more severe at lower price points: the least expensive 20% of the market was priced below $2,650 this year, but the number of rentals in this segment has fallen by 66.8% since 2019.
The Manhattan Rental Market Is Holding Steady
The median asking rent in Manhattan fell 1.7% from May to $4,400 in June, but remained steady from this time last year. The month-over-month decline during the busy summer leasing season likely reflects wavering demand from highly paid workers in Manhattan, as hiring in industries such as tech and finance has slowed since the summer of 2022. Cooling competition among renters likely made it harder for landlords to raise rents significantly above market rate.
Due to low vacancies, rental inventory in Manhattan began declining again after strong increases in 2023 and early this year. In June, 18,716 rentals were on the market, down 2.6% from a year ago. By comparison, rental inventory had been rising more than 25% year-over-year on average from June through September 2023.
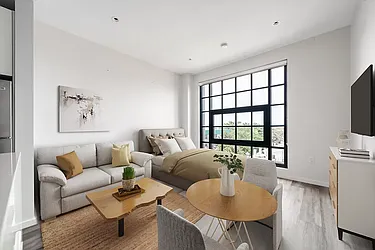
Manhattan Rentals Under $3,500 on StreetEasy Article continues below


Concessions are also steady in Manhattan, as declining inventory helped balance the softer demand. Nearly a tenth (9.8%) of available rentals in the borough offered at least one month of free rent in June, a slight increase from 9.5% a year ago. While competition among renters has been cooling, low vacancy rates likely allowed landlords to rely on concessions rather than price cuts to market their properties.
Demand has been more resilient in areas close to Midtown and its office districts, with fewer apartments offering concessions than in Downtown neighborhoods. In Midtown, 7% of rentals offered concessions in June, down from 9.4% one year ago. Concessions were the least common on the Upper East Side, where just 3.7% of rentals offered concessions, down from 6.1% a year ago. Comparatively, 8.2% of Downtown listings offered concessions, rising slightly from 7.6% a year ago.
The Bronx Is Leading the City in Affordable Rental Supply
Following a series of rezonings, a construction boom in the Bronx has expanded both market-rate and income-restricted affordable units across the borough. There were 1,031 market-rate rentals in the Bronx in June, a 15.5% jump from a year ago, with a median asking rent of $2,825. This jump in inventory can be attributed to the recent surge in new developments in the borough. The Bronx saw 9,842 new housing units in 2023, nearly double (97%) the total number of homes created in 2022 and the highest of all five boroughs, NYC Department of City Planning (DCP) data shows.
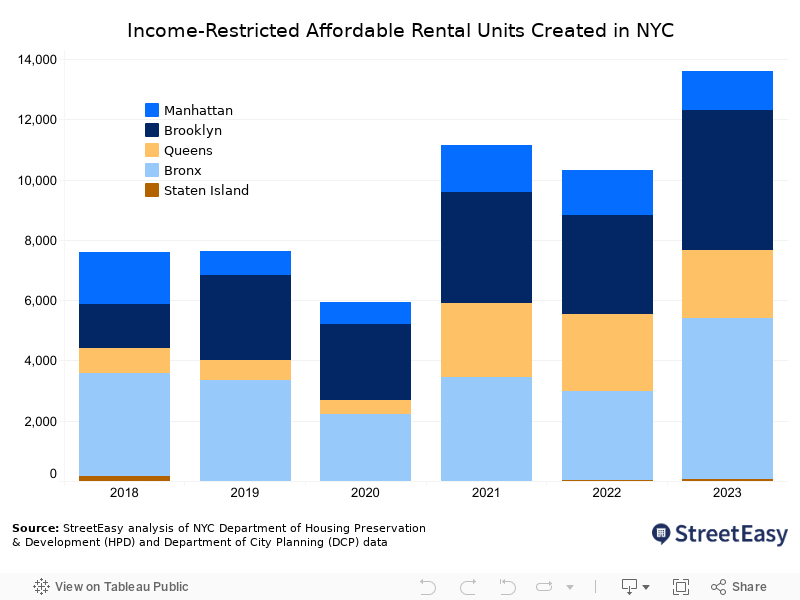
In addition to market-rate rentals, the Bronx added 5,335 affordable units serving low- to middle-income households, including supportive housing for the most vulnerable New Yorkers — more than any other borough. The record in 2023 marks an increase of 82.5% from the year before and accounted for 39% of all newly built affordable units in the city, according to StreetEasy analysis of NYC Department of Housing Preservation and Development (HPD) and DCP data.
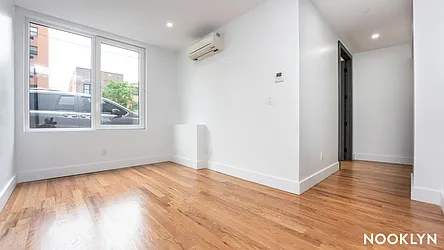
Bronx Rentals Under $2,500 on StreetEasy Article continues below


While the city’s affordable rental production has increased dramatically over the past five years, new construction has been concentrated in select high-density neighborhoods in the Bronx and Brooklyn with higher populations of people of color. In other areas, affordable housing production has been lagging due to the city’s outdated zoning rules in place since the 1960s. Targeted zoning reforms could help housing supply catch up with surging demand. Our analysis shows zoning reforms to allow modest increases in housing near public transit could unlock an opportunity to create up to 1.1 million new homes.
The new 485x tax incentive for affordable housing, plus an extension of the now-expired 421a tax abatement for projects already in construction to 2031, were approved in New York State’s FY25 budget. In addition to existing direct financing from New York City and State, these incentives make affordable housing construction less expensive, as developers can sacrifice fewer market-rate units to increase the number of affordable units in their buildings. These policies will greatly improve the effectiveness of a new zoning plan.
Brooklyn Remains Competitive While Queens Takes a Breather
The median asking rent in Brooklyn rose 3.8% year-over-year to $3,528 in June. In Queens, the median asking rent jumped 8.8% to $3,100. Rental inventory has been rising steadily in both boroughs. The number of rentals in Brooklyn rose 11.1% year-over-year to 12,955 units. In Queens, 4,456 rentals were on the market, also up 11.1% from the previous year.
Despite the recent increases in inventory, the rental market in Brooklyn remains competitive due to resilient renter demand. The average rental listing in Brooklyn has received 9.9% more inquiries than the average listing in Manhattan this year. As more new developments entered the market, competition for rentals eased slightly in Queens, with the average listing receiving 1.4% fewer inquiries than the average Manhattan listing.
Brooklyn Rentals Under $3,000 on StreetEasy Article continues below


High Upfront Costs Lock Renters into Their Current Homes
StreetEasy data shows the average upfront cost to move into a rental has soared 29% since 2019, before the pandemic disrupted the market. These soaring upfront costs — averaging more than $10,000 — create a lock-in effect that incentivizes renters to re-sign their leases rather than find a new home, and contribute to the city’s low vacancy rate.
The largest upfront expense is often the broker fee, a commission the renter is asked to pay the broker to secure the apartment. Across NYC, slightly more than half (52%) of rentals on the market this year were “no-fee,” meaning the tenant isn’t required to pay a broker fee. However, many of these no-fee rentals are found in luxury buildings with desirable amenities such as doormen and fitness centers.
Despite the lack of broker fees, many New Yorkers can’t afford the higher rents associated with these buildings. The median household income in NYC was $74,694 according to the 2022 ACS. A renter earning this income could pay up to $1,867 per month without being rent-burdened, defined by federal and local housing agencies as spending more than 30% of one’s income on rent. The median asking rent for a no-fee apartment was $4,085 in June, more than twice what the typical renter in the city can comfortably afford, and $285 a month more than the current citywide median asking rent.
Queens Rentals Under $2,500 on StreetEasy Article continues below


As a result, most New Yorkers are forced to compete for less expensive units with broker fees, while high-income individuals can avoid paying broker fees in amenity-rich luxury buildings. Due to the lower price point, the average rental listing in NYC with a broker fee received 45.2% more inquiries than the average no-fee listing this year, underscoring the dramatic disparity in challenges most renters face under the current system.
Lowering upfront rental costs through broker fee reform will help renters unlock their next home, making more units available on the market and creating opportunities for agents to connect new tenants to these rentals. But in helping more New Yorkers afford living and moving in the city, broker fee reform is only one piece of the puzzle. It must be paired with efforts to increase supply, combat housing discrimination, and eliminate other points of friction in the process.
Find your next NYC rental on StreetEasy
SEARCH NOWStreetEasy is an assumed name of Zillow, Inc. which has a real estate brokerage license in all 50 states and D.C. See real estate licenses. StreetEasy does not intend to interfere with any agency agreement you may have with a real estate professional or solicit your business if you are already under contract to purchase or sell property. All data for uncited sources in this presentation has been sourced from Zillow data. Copyright © 2024 by Zillow, Inc. and/or its affiliates. All rights reserved.


