

CHAPTER 3
Findings and Applications
This chapter discusses the results of the research performed. A portion of these results covering characterization, reactivity, and reactivity tests are detailed summaries of relevant content from seven studies led by the University of Miami (Y. Wang 2022; Y. Wang, Acarturk, et al. 2022; Y. Wang, Ramanathan, et al. 2022a; Y. Wang, Burris, et al. 2022; Y. Wang, Burris, et al. 2021; Y. Wang, Ramanathan, et al. 2022b; Y. Wang, Burris, et al. 2023).
Characterization Results
Some ashes were off-specification for various reasons under AASHTO M 295-21 (see Table 16). Some of the tested ashes, such as the CFB ash and bottom ash, are not covered under the current specification. Other off-specification limits of some of these ashes include the sulfate content (ash G, 17.4%), sum of oxides (ash G, 37.8%), fineness (ash L, 50.6% retained on the 45-µm sieve), water requirement (ash S, 110%), moisture content (ash T, 5.2%), LOI (ash U, 16.5%), and SAI (ash S). Two coarse ashes had greater than 10% retained on the 150-µm sieve (L and S), which is a new limit in ASTM C618-23e1. Several ashes were marginal for sum of oxides and LOI. Interestingly, most of the off-specification and marginal ashes were Class C. It is generally assumed that processed or beneficiated coal ashes (B, K, N, O, and R) are allowed in the AASHTO M 295 standard, although this is not explicitly stated.
The chemical properties of the coal ashes are classified in Table 17 as they relate to limits in AASHTO M 295-21; the physical properties of the ashes as they relate to limits in AASHTO M 295-21 are in Table 18. These coal ashes are discussed using the nomenclature in the “Paper Designation” column in Y. Wang, Acarturk, et al. (2022). XRF data in Table 17 showed a strong linear correlation between MgO and CaO contents, which did not change with storage or processing. Excluding one ash with very high SO3 content, there was also a moderate correlation between SO3 and CaO contents. This finding is well-known from literature but not for unconventional ashes. One implication of these correlations is the potential for durability concerns associated with SO3 and MgO contents to increase in Class C ashes, whether standard or not. With regard to composition, several unconventional ashes showed properties not seen in standard ashes—most commonly differences in SO3, sum of the oxides, and LOI.
The mineral phase contents for each ash are displayed in Tables 19, 20, and 21. XRD data showed all ashes were highly amorphous, with amorphous contents ranging from 40% to 93%, averaging 73%. Average values were significantly greater for Class F (81%) than Class C (57%). Class F ashes had mullite and quartz as major crystalline phases whereas Class C’s were quartz, C3A, and merwinite. The off-specification high-SO3 ash (17.4%) which was very fine (median particle size d50 = 4.1 µm) had unique crystalline phases including enstatite (13.6%), scawtite (8.1%), and bassanite (6.0%), among others.
Table 16. AASHTO M 291-21 compliance of coal ashes.
| Sample | AASHTO M 295-21 (Pass or Fail) | Specification Limit(s) Failed |
|---|---|---|
| Standard Ashes | ||
| A | Pass | 7-day SAI |
| D | Pass | None |
| E | Pass | None |
| F | Pass | 7-day SAI |
| H | Pass | None |
| I | Pass | None |
| P | Pass | None |
| Q | Pass | None |
| Unconventional Ashes | ||
| B | Pass | None (processed) |
| K | Pass | None (processed) |
| M | Fail | 7- and 28-day SAIs, harvested |
| N | Pass | None (processed) |
| O | Pass | None (processed) |
| R | Pass | None (processed) |
| S | Fail | 7-, 28-, and 56-day SAIs, WR, harvested |
| C | Fail | WR, CFB ash |
| G | Fail | ΣSiO2 + Al2O3 +Fe2O3, SO3 |
| J | Pass | None |
| L | Fail | 45 μm sieve retention, 7-day SAI |
| T | Fail | Moisture, harvested |
| U | Fail | LOI, 45 μm sieve retention, WR, harvested |
| V | Fail | Bottom ash blend |
Moisture contents determined from TGA and/or oven were low for all ashes, with the maximum value < 1.0% and average 0.22%. LOI values were generally lower than 5% when determined using either method, with a few notable high-LOI unconventional ash exceptions. In general, LOI at 750°C and 950°C using furnace/TGA were correlated, suggesting temperature choice was not particularly important for trends (Figure 1). However, the correlation was not 1:1 and LOI values from the TGA at 950°C were two to three times higher than those at the lower temperature of 750°C. The correlation for the LOI from the furnace was closer to 1:1. Both temperature and test method affected LOI values because of the complex chemistry of coal ashes. In both cases, the carbonates decomposed and organic matter volatilized. When tested in nitrogen, unburnt carbon did not burn or oxidize, but could reduce iron oxides/sulfides and produce carbon dioxide or monoxide, leading to weight loss, which typically occurs beyond 700°C but is more obvious at 950°C. For such coal ashes, LOI using TGA at 950°C was much higher than the TGA value at 750°C. In air, the unburnt carbon could burn/oxidize to CO2, and sulfides, sulfur, and iron minerals could oxidize and gain weight, which reduced the LOI. For Class F ashes, the furnace LOI at 950°C increased with Fe2O3 content, but there was no such trend for Class C ashes, showing that iron content may be a contributor to LOI in Class F ashes at 950°C. LOI and LOI values from TGA were not correlated at either temperature. Due to the simplicity of the ignition tests, using LOI (with either test) as an indicator of AEA adsorption is misleading, because carbon is one of several substances responsible for LOI. However, the LOI using the furnace at 750°C is likely the “best” test, given issues with atmosphere and higher-temperature testing (Y. Wang, Burris, et al. 2022).
Particle size was similar for most of the coal ashes used in this testing. Only a select number of coal ashes had significantly different particle size distributions. Particle size distributions for the Class F ashes are shown in Figure 2 and for the Class C ashes in Figure 3. Ash J (the cyclone collector ash) and K (the Class C surfactant-modified ash) were significantly finer than the majority of coal ashes. S, a reclaimed coal ash and L, specifically chosen for its high coarseness, were significantly coarser than the other ashes. Fineness, determined using ASTM C430 methods, the Blaine fineness, and the d50 of the ashes, is shown in Table 18. These data show that at least some of the unconventional fly ashes (L and S) have unusual fineness.
Table 17. Chemical properties of the coal ashes.
| Samples | Paper Designation | Beneficiated | Class | Supplier Notes | SiO2 + Al2O3 + Fe2O3 (%) | CaO (%) | SO3 (%) | Moisture Content (%) | LOI (%) | SiO2 (%) | Al2O3 (%) | Fe2O3 (%) | MgO (%) | K2O (%) | Na2O (%) | Na2Oeq (%) |
|---|---|---|---|---|---|---|---|---|---|---|---|---|---|---|---|---|
| 50% min | ≤ 18, F > 18, C | 5% max | 3% max | 5% max | N/A | N/A | N/A | N/A | N/A | N/A | 4.5% max – R80, Class F ashes | |||||
| Standard Ashes | ||||||||||||||||
| A | F1 | N | F | Class F, in-spec | 83.4 | 5.4 | 0.41 | 0.23 | 0.64 | 55.6 | 17.4 | 10.4 | 1.4 | 2.6 | 1.2 | 2.87 |
| D | C2 | N | C | Class C, in-spec | 63.5 | 19.9 | 0.80 | 0.30 | 0.69 | 40.4 | 18.6 | 4.6 | 3.7 | 0.6 | 1.4 | 1.8 |
| E | C3 | N | C | Class C with high SO3 and marginal oxides | 50.1 | 25.3 | 2.75 | 0.18 | 0.79 | 31.2 | 15.2 | 3.6 | 7.5 | 0.3 | 1.7 | 1.94 |
| F | F3 | N | F | Class F with high LOI | 82.3 | 3.7 | 0.54 | 0.11 | 4.88 | 47.2 | 19.0 | 16.1 | 0.9 | 2.5 | 0.9 | 2.51 |
| H | C5 | N | C | Class C with marginal oxides | 50.9 | 24.8 | 2.18 | 0.45 | 1.43 | 31.4 | 14.6 | 5.0 | 6.9 | 0.3 | 1.9 | 2.13 |
| I | F4 | N | F | Class F, in-spec | 71.1 | 11.9 | 0.58 | 0.11 | 0.34 | 52.0 | 14.0 | 5.0 | 4.3 | 2.1 | 3.6 | 5.02 |
| P | F10 | N | F | Class F, in-spec | 88.7 | 1.7 | 0.10 | 0.23 | 3.83 | 51.6 | 25.9 | 11.2 | 1.0 | 2.3 | 0.4 | 1.89 |
| Q | F11 | N | F | Class F with high LOI | 82.2 | 5.0 | 0.65 | 0.18 | 4.62 | 41.9 | 20.1 | 20.2 | 0.7 | 1.5 | 0.7 | 1.71 |
| Unconventional Ashes | ||||||||||||||||
| B | F2* | Y | F | Off-spec ash, beneficiated by sieving/grinding | 84.0 | 4.3 | 0.08 | 0.17 | 0.43 | 60.7 | 20.9 | 2.4 | 0.8 | 2.2 | 4.3 | 5.75 |
| K | C6* | Y | C | Surfactant beneficiated ash with marginal oxides | 51.2 | 24.8 | 2.05 | 0.15 | 0.95 | 31.3 | 16.2 | 3.7 | 7.2 | 0.3 | 1.6 | 1.85 |
| M | F7* | Y | F | Reclaimed ash, dried and sieved, off-spec fineness | 83.3 | 2.1 | 0.21 | 0.30 | 2.90 | 46.7 | 24.4 | 12.3 | 0.9 | 2.4 | 0.2 | 1.76 |
| N | F8-BL^* | Y | F | Blend of Class C and Class F ashes | 69.2 | 14.5 | 0.69 | 0.14 | 0.79 | 43.8 | 20.0 | 5.5 | 3.5 | 1 | 1.3 | 1.95 |
| O | F9* | Y | F | LOI electrostatic beneficiated ash | 82.4 | 4.7 | 1.27 | 0.77 | 2.57 | 48.8 | 18.8 | 14.8 | 0.9 | 2.3 | 0.7 | 2.23 |
| R | F12* | Y | F | Beneficiated ash by HT, high fineness | 90.5 | 2.2 | 0.11 | 0.10 | 0.70 | 52.2 | 29.1 | 9.2 | 1.0 | 2.6 | 0.4 | 2.05 |
| S | F13* | Y | F | Reclaimed ash, beneficiated by HT, extreme coarseness | 92.0 | 1.5 | 0.11 | 0.10 | 0.30 | 54.8 | 27.6 | 9.6 | 0.9 | 2.4 | 0.3 | 1.85 |
| C | C1-CFB^ | N | C | CFB ash | 65.7 | 18.5 | 4.11 | 0.22 | 0.69 | 46.1 | 16.6 | 3.0 | 2.4 | 1.1 | 0.3 | 1.00 |
| G | C4 | N | C | Off-spec ash, off-spec SO3 | 37.8 | 25.5 | 17.45 | 1.05 | 2.08 | 26.6 | 7.8 | 3.4 | 3.9 | 0.8 | 3.4 | 3.94 |
| J | F5-CCA^ | N | F | Cyclone collector ash | 61.5 | 15.3 | 2.28 | 0.28 | 3.10 | 34.1 | 16.8 | 10.6 | 3.8 | 1.5 | 1.9 | 2.92 |
| L | F6 | N | F | Off-spec, low fineness, extreme coarseness | 86.4 | 3.9 | 0.10 | 0.09 | 0.22 | 63.7 | 19.9 | 2.8 | 0.7 | 2.2 | 3.9 | 5.29 |
| T | F14 | N | F | Harvested impounded ash, off-spec moisture content | 90.8 | 2.4 | 1.01 | 5.19 | 5.00 | 47.9 | 22.7 | 15.3 | 0.8 | 2.1 | 0.9 | 2.39 |
| U | F15 | N | F | High-LOI ponded ash blend | 73.7 | 1.9 | 0.56 | ----- | 16.46 | 41.9 | 18.5 | 13.3 | 0.6 | 1.7 | 1.1 | 2.22 |
| V | F16* | Y | F | Bottom ash blend | 84.6 | 6.1 | 0.21 | 0.20 | 2.43 | 60.9 | 18.7 | 4.9 | 1.0 | 1.4 | 2.1 | 2.05 |
Note: sum of the primary oxide contents = (SiO2+Al2O3+Fe2O3)
HT = high-temperature treatment
* = beneficiated
^ = not covered in the specification
bold = off-specification properties
bold italic = marginal properties
Table 18. Physical properties of the coal ashes.
| Samples | Paper Designation | Beneficiated | Class | Supplier Notes | Fineness 45 μm % retained (sieved) | Fineness 45 μm % retained (PSD) | Fineness 150 μm % retained (sieved) | 7-day SAI (%) | 28-day SAI (%) | 56-day SAI** (%) | Water Req. (%) | SG (kg/m3) | SSA (laser) (m2/kg) | Blaine Fineness (m2/kg) | d50 (mm) N/A |
|---|---|---|---|---|---|---|---|---|---|---|---|---|---|---|---|
| 34, max | 34, max | N/A | 75, min | 75, min | 75, min | 105, max | N/A | N/A | N/A | N/A | |||||
| Standard Ashes | |||||||||||||||
| A | F1 | N | F | Class F, in-spec | 24.4 | 29.4 | 1.0 | 68 | 77 | 78 | 92 | 2.37 | 513 | 240.6 | 20.4 |
| D | C2 | N | C | Class C, in-spec | 15.0 | 24.6 | 1.0 | 82 | 87 | 94 | 100 | 2.59 | 685 | 402.1 | 16.6 |
| E | C3 | N | C | Class C with high SO3 and marginal oxides | 8.9 | 14.3 | 0.5 | 124 | 91 | 112 | 94 | 2.78 | 833 | 413.4 | 9.8 |
| F | F3 | N | F | Class F with high LOI | 21.7 | 24.0 | 4.1 | 72 | 82 | 95 | 91 | 2.45 | 457 | 227.7 | 18.3 |
| H | C5 | N | C | Class C with marginal oxides | 12.4 | 20.6 | 1.5 | 81 | 100 | 101 | 94 | 2.84 | 753 | 405.1 | 12.7 |
| I | F4 | N | F | Class F, in-spec | 21.4 | 36.0 | 2.1 | 100 | 98 | 99 | 88 | 2.55 | 491 | 291.4 | 24.6 |
| P | F10 | N | F | Class F, in-spec | NM | 20.2 | 2.4 | 86 | 96 | 110 | 100 | 2.57 | 544 | 299.6 | 14.3 |
| Q | F11 | N | F | Class F with high LOI | NM | 30.3 | 1.1 | 79 | 84 | 92 | 104 | 2.38 | 445 | 221.2 | 23.2 |
| Unconventional Ashes | |||||||||||||||
| B | F2* | Y | F | Off-spec ash, beneficiated by sieving/grinding | 22.7 | 31.5 | 1.2 | 77 | 86 | 91 | 100 | 1.89 | 374 | 215.4 | 25.7 |
| K | C6* | Y | C | Surfactant beneficiated ash with marginal oxides | 11.9 | 21.9 | 1.1 | 100 | 96 | 98 | 88 | 2.84 | 764 | 422.6 | 12.5 |
| M | F7* | Y | F | Reclaimed ash, dried and sieved, off-spec fineness | 27.6 | 36.2 | 5.5 | 71 | 69 | 78 | 94 | 2.43 | 473 | 345.9 | 24.9 |
| N | F8-BL^* | Y | F | Blend of Class C and Class F ashes | 27.6 | 30.7 | 2.5 | 79 | 102 | 99 | 94 | 2.52 | 575 | 345.6 | 20.5 |
| O | F9* | Y | F | LOI electrostatic beneficiated ash | 19.0 | 24.1 | 1.4 | 79 | 89 | 96 | 100 | 2.43 | 551 | 291.0 | 16.4 |
| R | F12* | Y | F | Beneficiated ash by HT, high fineness | 12.4 | 12.8 | 0.4 | 82 | 95 | 97 | 102 | 2.49 | - | 290.1 | 13.3 |
| S | F13* | Y | F | Reclaimed ash, beneficiated by HT, extreme coarseness | 22.1 | 60.4 | 12.1 | 68 | 62 | 69 | 110 | 2.38 | 249 | 149.0 | 62.6 |
| C | C1-CFB^ | N | C | CFB ash | 31.1 | 31.6 | 1.0 | 78 | 86 | 89 | 107 | 2.59 | 538 | 320.2 | 22.4x |
| G | C4 | N | C | Off-spec ash, off-spec SO3 | 15.9 | 15.5 | 0.6 | 79 | 85 | 97 | 94 | 2.55 | 1590 | 306.0 | 4.1 |
| J | F5-CCA^ | N | F | Cyclone collector ash | 10.6 | 15.8 | 4.2 | 106 | 87 | 108 | 94 | 2.79 | 789 | 454.6 | 9.9 |
| L | F6 | N | F | Off-spec, low fineness, extreme coarseness | 50.6 | 63.1 | 14.6 | 70 | 79 | 80 | 100 | 1.76 | 115 | 152.4 | 66.2 |
| T | F14 | N | F | Harvested impounded ash, off-spec moisture content | NM | 31.2 | 6.0 | 77 | 92 | 89 | 100 | 2.56 | - | 214.9 | 23.1 |
| U | F15 | N | F | High-LOI ponded ash blend | NM | 34.9 | 6.7 | 75 | 89 | 93 | 106 | 2.42 | - | 264.9 | 24.9 |
| V | F16* | Y | F | Bottom ash blend | 14.0 | 16.8 | 0.3 | 84 | 97 | 96 | 102 | 2.38 | - | 370.4 | 16.1 |
Note: HT = high-temperature treatment
* = beneficiated
** = not measured, determined via regression
^ = not covered in the specification
bold = off-specification properties
bold italic = marginal properties
45 μm retained = retention on U.S. standard sieve no. 325
150 μm retained = Retention on U.S. standard sieve no. 100
(laser) = attained via laser diffraction
NM = not measured
x = not accurate due to dispersion issues related to agglomerated but highly porous spongy particle
Table 19. Phase composition (%) of the Class F coal ashes determined using the Rietveld method.
| Sample | Class | Suppliers’ Notes | Amorphous | Hematite (Fe2O3) | Mullite (Al4+8Si2-8O10-6) | Magnetite (Fe3O4) | Maghemite ((Fe3+0.67-0.33)Fe3+2O4) | Merwinite (Ca3Mg(SiO4)2) | Magnesium Oxide (MgO) | Quartz (SiO2) | Anhydrite (CaSO4) | Free Calcium (CaO) | Calcite (CaCO3) | Monalbite (NaAlSi3O8) |
|---|---|---|---|---|---|---|---|---|---|---|---|---|---|---|
| Standard Ashes | ||||||||||||||
| A | F | Class F, in-spec | 85.3 | 1.1 | 1.7 | 1.8 | 0.0 | 0.0 | 0.0 | 6.8 | 0.9 | 0.0 | 2.3 | 0.0 |
| F | F | Class F with high LOI | 79.7 | 3.0 | 6.2 | 0.0 | 3.4 | 0.0 | 0.0 | 5.9 | 1.3 | 0.5 | 0.0 | 0.0 |
| I | F | Class F, in-spec, off-spec fineness | 92.2 | 0.4 | 0.1 | 0.0 | 0.3 | 2.0 | 1.2 | 3.5 | 0.3 | 0.1 | 0.0 | 0.0 |
| P | F | Class F, in-spec | 70.9 | 1.4 | 16.5 | 0.7 | 1.3 | 0.0 | 0.0 | 8.0 | 0.7 | 0.3 | 0.0 | 0.0 |
| Q | F | Class F with high LOI | 72.9 | 2.3 | 9.4 | 2.0 | 2.7 | 0.2 | 0.4 | 7.0 | 2.2 | 0.4 | 0.0 | 0.0 |
| Unconventional Ashes | ||||||||||||||
| B | F | Off-spec ash, beneficiated by sieving/grinding | 88.7 | 0.3 | 5.5 | 0.2 | 0.8 | 0.1 | 0.0 | 2.5 | 0.5 | 0.1 | 0.0 | 1.3 |
| J | F | Cyclone collector ash | 92.7 | 0.8 | 0.0 | 1.8 | 0.0 | 0.0 | 0.0 | 0.4 | 4.4 | 0.0 | 0.0 | 0.0 |
| L | F | Off-spec, low fineness, extreme coarseness | 86.8 | 0.5 | 6.2 | 0.0 | 0.8 | 0.0 | 0.0 | 3.3 | 0.4 | 0.0 | 0.0 | 2.0 |
| M | F | Reclaimed ash, dried and sieved, off-spec fineness | 80.9 | 1.5 | 10.6 | 1.0 | 1.1 | 0.0 | 0.0 | 4.2 | 0.7 | 0.0 | 0.0 | 0.0 |
| N | F | Blend of Class C and Class F ashes | 82.7 | 0.9 | 3.0 | 0.5 | 0.0 | 4.7 | 1.2 | 6.5 | 0.6 | 0.0 | 0.0 | 0.0 |
| O | F | LOI electrostatic beneficiated ash | 80.4 | 1.7 | 5.3 | 2.2 | 1.8 | 0.0 | 0.0 | 6.9 | 1.2 | 0.2 | 0.0 | 0.0 |
| R | F | Beneficiated ash by HT, high fineness | 70.0 | 2.9 | 16.9 | 0.0 | 0.7 | 0.0 | 0.0 | 9.0 | 0.1 | 0.4 | 0.0 | 0.0 |
| S | F | Reclaimed ash, beneficiated by HT, extreme coarseness | 73.1 | 2.3 | 17.3 | 0.0 | 0.5 | 0.0 | 0.1 | 6.0 | 0.4 | 0.4 | 0.0 | 0.0 |
| T | F | Harvested impounded ash, off-spec moisture content | 76.2 | 2.6 | 9.8 | 0.0 | 3.4 | 0.0 | 0.0 | 7.7 | 0.2 | 0.1 | 0.0 | 0.0 |
| U | F | High LOI ponded ash blend | 68.9 | 4.0 | 12.7 | 3.5 | 0.0 | 0.0 | 0.0 | 10.1 | 0.4 | 0.5 | 0.0 | 0.0 |
| V | F | Bottom ash blend | 78.0 | 0.0 | 3.1 | 0.5 | 0.0 | 0.0 | 0.0 | 16.8 | 0.3 | 0.0 | 0.0 | 0.0 |
Note: Determination of phase content by the Rietveld method is typically not accurate to more than 1%, but phase compositions are shown to 0.1% as an indication of the presence of particular minerals in the sample and to provide a relative indication of the overall quantity present.
Table 20. Phase composition (%) of the Class C coal ashes determined using the Rietveld method.
| Sample | Class | Suppliers’ Notes | Amorphous | Hematite (Fe2O3) | Mullite (Al4+8Si2-8O10-6) | Magnetite (Fe3O4) | Maghemite ((Fe3+0.67-0.33)Fe3+2O4) | Merwinite (Ca3Mg(SiO4)2) | Magnesium Oxide (MgO) | Quartz (SiO2) | Cubic Tricalcium Aluminate ((CaO)3Al2O3) | Belite (Ca2SiO2) | Ye'elimite (Ca4Al6O12SO4) |
|---|---|---|---|---|---|---|---|---|---|---|---|---|---|
| Standard Ashes | |||||||||||||
| D | C | Class C, in-spec | 77.8 | 0.3 | 2.1 | 0.5 | 0.0 | 3.8 | 1.2 | 5.5 | 5.4 | 0.0 | 0.0 |
| E | C | Class C with high SO3 and marginal oxides | 55.6 | 0.3 | 0.7 | 0.0 | 0.0 | 4.6 | 6.1 | 6.2 | 9.2 | 5.0 | 1.9 |
| H | C | Class C with marginal oxides | 60.0 | 0.5 | 2.3 | 0.0 | 0.0 | 6.0 | 5.5 | 5.9 | 10.0 | 6.4 | 0.0 |
| Unconventional Ashes | |||||||||||||
| C | C | CFB ash | 39.8 | 0.0 | 0.5 | 0.0 | 0.7 | 1.5 | 1.0 | 21.4 | 3.9 | 6.4 | 0.0 |
| G | C | Off-spec ash, off-spec SO3 | 42.6 | 0.0 | 3.3 | 0.0 | 0.0 | 3.7 | 0.0 | 1.0 | 2.4 | 4.2 | 0.0 |
| K | C | Surfactant beneficiated ash with marginal oxides | 65.0 | 0.5 | 0.0 | 0.0 | 0.0 | 3.1 | 5.1 | 4.6 | 7.6 | 4.3 | 0.9 |
Table 21. Phase composition (%) of the Class C coal ashes determined using the Rietveld method.
| Sample | Class | Suppliers’ Notes | Anhydrite (CaSO4) | Bassanite (Ca(SO4)·0.5H22O) | Gypsum (CaSO4·2H2O) | Free Calcium (CaO) | Portlandite (Ca(OH)2) | Calcite (CaCO3) | Gehlenite (Ca2Al(Al,Si)O7) | Monalbite (NaAlSi3O8) | Enstatite (MgSiO3) | Ammonium Iron Fluoride ((NH4)3FeF6) | Ammonium Dihydrogen Phosphate (NH4H2PO) | Scawtite (Ca7Si6(CO3)O18·2(H2O)) | Arcanite (K2SO4) |
|---|---|---|---|---|---|---|---|---|---|---|---|---|---|---|---|
| Standard Ashes | |||||||||||||||
| D | C | Class C, in-spec | 1.0 | 0.0 | 0.0 | 0.3 | 0.0 | 0.8 | 1.4 | 0.0 | 0.0 | 0.0 | 0.0 | 0.0 | 0.0 |
| E | C | Class C with high SO3 and marginal oxides | 3.1 | 0.0 | 0.0 | 2.8 | 0.0 | 2.9 | 1.6 | 0.0 | 0.0 | 0.0 | 0.0 | 0.0 | 0.0 |
| H | C | Class C with marginal oxides | 2.0 | 0.0 | 0.0 | 1.6 | 0.0 | 1.8 | 3.6 | 0.0 | 0.0 | 0.0 | 0.0 | 0.0 | 0.0 |
| Unconventional Ashes | |||||||||||||||
| C | C | CFB ash | 10.1 | 0.0 | 0.0 | 3.9 | 0.0 | 5.4 | 5.6 | 0.0 | 0.0 | 0.0 | 0.0 | 0.0 | 0.0 |
| G | C | Off-spec ash, off-spec SO3 | 0.0 | 6.0 | 1.4 | 0.0 | 2.2 | 1.9 | 1.7 | 0.0 | 13.6 | 4.8 | 2.0 | 8.1 | 1.1 |
| K | C | Surfactant beneficiated ash with marginal oxides | 2.0 | 0.0 | 0.0 | 2.2 | 0.0 | 1.5 | 3.0 | 0.0 | 0.0 | 0.0 | 0.0 | 0.0 | 0.0 |


Figure 2. Particle size distribution of the Class F ashes.

Figure 3. Particle size distribution of the Class C ashes.
In ASTM C618-23e1, a new maximum limit of 10% retained on the 150-µm sieve was introduced for harvested or coal ash containing bottom ash. This limit has not yet been added to AASHTO M 295. For this set of coal ashes, two coarse ashes had greater than 10% retained on the 150-µm sieve (L and S). However, whether coal ash L is harvested or contains bottom ash is unclear as this information was not provided by the supplier. There has been debate about the limit value at ASTM, with 5% being suggested instead of 10%. If the limit were set at 5%, five ashes (S, L, M, T, and U) would not pass. Four of these ashes did not pass other AASHTO M 295 specification limits, including for fineness (45-µm sieve), moisture content, LOI, and SAI. However, coal ash M would pass, and this ash performed well in concrete. From this dataset, it appears that the 5% limit may be overly restrictive for some coal ashes like M, and the 10% limit is more appropriate.
Coal ash particle morphology was typically complex and variable (see Figure 4). Some unconventional ashes showed a greater number of fractured particles due to beneficiation using grinding (Figure 4b). Irregular, larger particles were seen in some ashes (Figure 4d). Notably, particles in the CFB ash were irregular, angular, and highly porous, and very different from standard ashes (Figure 4c). Some ashes showed the presence of larger irregular-shaped particles, presumed to be carbon (Figure 4d), and there were trapped fly ash particles in some cases. As expected, the fly ashes off-specification for fineness showed a number of larger particles, both regular and irregular. Unusual morphologies were common in the unconventional ashes due to storage, weather, beneficiation, or to a different type of source.
Most coal ashes were composed of particles with a d50 between 10 and 25 µm. However, there were two very coarse ashes with 66.2 µm and 62.6 µm d50, and one very fine ash with 4.1 µm d50. The two coarsest ashes were off-specification for fineness (L and S). There was a strong nonlinear relationship between SSA and d50 values determined from laser diffraction (see Figure 5). There was a strong positive linear relationship between the 45-µm sieve retained amount and the d50 (see Figure 5); likewise between the Blaine fineness and laser diffraction SSA (see Figure 6). The laser diffraction SSA values were almost double the values from the Blaine test. While there were a few outliers, the strong correlations between the three measures show that one measurement is adequate and could be used to estimate the others for all coal ashes in most cases. The 45-µm retained value from sieving and laser diffraction were strongly correlated when coal ash S was removed

Figure 4. SEM morphologies of particles from four different coal ashes.


(Figure 7). Coal ash S showed a 40% difference in the 45-µm retained value between the sieve and the laser diffraction. All other test methods show coal ash S to be very coarse, which suggests the 45-µm retained value from sieving is inaccurate. For all other materials, on average, the difference between the two tests was 6%; the value from laser diffraction was in almost all cases higher, and the correlation was not 1:1. It is unclear why this is, but it could be related to particle morphology, test assumptions regarding particle shape, or test errors.
A comparison of the amorphous content in the standard and unconventional ashes is shown in Figure 8. Average coal ash amorphous content for the sample set was similar between the standard and unconventional coal ashes—averaging 75.3% and 78.2%, respectively. However, several of the unconventional ashes had very small amorphous contents; ashes C and G, the CFB and high-sulfate ashes, had amorphous contents of 39.8% and 42.6%, respectively. The lower amorphous contents in these ashes were accompanied by high levels of quartz and anhydrite in the CFB ash and high levels of enstatite (MgSiO3), bassanite [Ca(SO4)-0.5H2O], scawtite [Ca7Si6(CO3)O18·2(H2O)], and several other crystalline phases in ash G. Ashes E and H also had lower than normal amorphous content


Figure 8. Comparison of amorphous content in the standard and unconventional ashes.
(55.6 and 60.0%, respectively). Both standard Class C ashes had lower amorphous content due to the presence of high quartz, tricalcium aluminate (C3A), and belite (C2S) contents.
Overall, it does not seem that unconventional ashes are significantly different from standard sources of coal ash in terms of crystalline phase composition or amorphous content other than the two outliers. Additionally, amorphous content cannot be used as a definitive determinant of ash performance as several of these ashes with low amorphous content yielded high measures of reactivity in subsequent reactivity testing (see Table 22), and all exceeded the SAI limits shown in the Mortar Testing Results section.
Table 22. Results of R3 (7-day) and MR3 (10-day) reactivity tests.
| Samples | R3 | MR3 | ||
|---|---|---|---|---|
| Heat (J/g SCM) | Bound Water (g/100 g SCM) | Heat (J/g SCM) | Bound Water (g/100 g SCM) | |
| Standard Ashes | ||||
| A | 203.0 | 6.7 | 304.8 | 19.0 |
| D | 358.4 | 15.6 | 319.3 | 25.1 |
| E | 412.7 | 15.6 | 277 | 25.2 |
| F | 188.3 | 6.3 | 291.7 | 19.6 |
| H | 369.5 | 15 | 254.8 | 23.0 |
| I | 258.4 | 9.5 | 272.2 | 19.0 |
| P | 215.5 | 7.7 | 316.1 | 18.9 |
| Q | 157.0 | 6.2 | 287.6 | 18.5 |
| Unconventional Ashes | ||||
| B | 255.4 | 8.8 | 306.5 | 20.0 |
| K | 372.0 | 16.9 | 309.7 | 21.9 |
| M | 242.7 | 9.4 | 337.4 | 20.5 |
| N | 361.9 | 14.4 | 349.3 | 20.3 |
| O | 167.1 | 6.6 | 302.4 | 18.2 |
| R | 152.0 | 5.4 | 258.8 | 15.7 |
| S | 75.0 | 4.0 | 205.0 | 13.5 |
| C | 420.2 | 13.9 | 316.4 | 22.2 |
| G | 221.8 | 7.8 | 239.4 | 15.4 |
| J | 345.6 | 12.1 | 347.7 | 25.3 |
| L | 182.2 | 7.6 | 246.3 | 16.8 |
| T | - | 6.2 | 329.7 | 18.7 |
| U | - | 5.6 | 297.1 | 18.4 |
| V | - | 6.8 | 341.9 | 20.2 |
While some unconventional coal ashes displayed unusual properties, including excessive SO3 content, large 45-µm sieve retention, high LOI, and angular porous morphology, many unconventional ashes among those studied did not show properties substantially different from standard ones, suggesting that their use in concrete should be strongly considered. However, other results on pastes, mortar, and concrete are needed to confirm the suitability of these ashes for concrete.
Characterization findings:
- Unconventional ashes for the most part showed similar physicochemical properties to standard ashes when beneficiated, though some showed outlier properties.
- Outlier properties for unconventional ashes included increased particle size, high LOI, and high SO3.
- LOI determined from TGA or furnace depends on a number of factors, including temperature and test method, and is influenced by the complex chemistry of oxidation and reduction of carbon, sulfur, and iron. It is not simply a measure of carbon.
- Quantitative x-ray diffraction (QXRD) characterization showed generally similar amorphous or glassy phases between unconventional and standard ashes despite varied elemental exposure and storage conditions.
- XRF characterization showed similar general bulk compositions and several moderate to strong correlations between anticipated oxides, notably CaO to MgO and SO3, for both standard and unconventional ashes.
- Fineness testing established strong correlations between fineness measurements of SSA, d50, and 45-µm sieve retention from Blaine, laser diffraction, and the sieve test, indicating that one could be implemented to estimate the others.
Reactivity Results
R3 and modified R3 Method
The reactivity of the coal ashes that were characterized was measured in addition to calcined clay (CL), ground granulated blast furnace slag (FS), silica fume (SF), limestone (LS), basaltic fines (BT), and quartz (Q). Powder composition and fineness were determined using XRF and laser diffraction, respectively, as described in the characterization study. The inert fines have similar particle sizes to the reactive ashes.
Table 22 shows the results for all ashes; the results are summarized in Table 23. Figure 9 shows R3 data for two Class F ashes (A and F), two Class C ashes (C and D), and two inert fillers (LS and BT)
Table 23. Results of R3 (7-day) and MR3 (10-day) reactivity tests summary, shown as average ± standard deviation.
| Ash Type | R3 Heat (J/g SCM) | R3 Bound Water (g/100 g SCM) | MR3 Heat (J/g SCM) | MR3 Bound Water (g/100 g SCM) |
|---|---|---|---|---|
| Standard | 286.5 ± 91.7 | 10.3 ± 4.3 | 290.4 ± 22.3 | 21.0 ± 2.9 |
| Unconventional | 285.4 ± 91.2 | 9.0 ± 3.9 | 299.1 ± 45.1 | 19.1 ± 3.1 |
| Filler | 27.0 ± 4.4 | 1.8 ± 0.7 | 28.5 ± 14.0 | 5.1 ± 2.1 |
| Class F | 252.6 ± 72.2 | 8.2 ± 3.2 | 300.8 ± 40.6 | 19.3 ± 3.0 |
| Class C | 359.1 ± 71.7 | 14.1 ± 3.3 | 286.1 ± 34.1 | 22.1 ± 3.6 |

to provide an illustration of reactivity (heat release) curves. Corresponding modified R3 data are shown in Figure 10 for these materials. Some data are missing due to measurement error.
Both tests show significantly greater heat release for the coal ashes than for the inert fillers. However, the heat release is test method- and coal ash class-dependent. In the R3 test, the heat release of Class C ashes is much greater than of Class F ashes through the experiment duration. While this is initially true for the modified R3 test, in this case, the Class F ashes eventually catch up with Class C toward the end of the test. There was no obvious difference between standard and unconventional ashes using either test. As an example, in the R3 test, the coarse ashes showed the lowest heat release, but the highest heat release was also from an unconventional ash. However, similarly high and low values of heat release were also seen in standard ashes. Thus, consistent with results from the characterization, some unconventional ashes may show outlier behavior,


but overall, ash type appears a better predictor of performance. Low fineness (coarse particles), however, generally does seem to reduce heat release.
Heat release values for the ashes, classified using standard vs. unconventional and Class F vs. Class C, are shown in Figures 11, 12, 13, and 14. Inert LS and BT showed heat release < 50 J/g SCM in both tests. This is in line with typical heat release thresholds for inert materials, ranging from 50 to 100 J/g SCM (Li et al. 2018, Y. Wang, Ramanathan, et al. 2022a). Both R3 and modified R3 tests were able to differentiate inert materials from reactive materials using these thresholds. All coal ashes were reactive and generated heat release > 100 J/g SCM, suggesting they could be used in concrete. In the R3 test, coal ashes showed heat release 150–420 J/g SCM, whereas the modified R3 test was 200–350 J/g SCM. The more reactive calcined clay (CL), furnace slag (FS), and SF showed heat release 500–600 J/g SCM in both tests. In the R3 test, heat release for Class C ashes, about 350 J/g SCM, was considerably higher than Class F ashes, about 250 J/g SCM. In the modified R3 test, there was no difference in the ultimate heat release between Class C and Class F ashes, with heat release around 290 J/g SCM. While the modified R3 test did not show a consistent difference in the heat release of Class C and Class F ashes at 10 days, it did at 1 day.


Both standard and unconventional ashes showed on average a heat release around 290 J/g SCM, irrespective of test type, suggesting no significant difference between them in terms of reactivity.
The distinction between reactive and inert materials was even more evident in the modified R3 test, and the heat release curves of materials excluding Class F coal ashes plateaued at the end of 240 hours (10 days) (see Figure 10). The curves for siliceous materials, including Class F coal ashes, did not plateau at 7 days in the R3 (Figure 9).
All unconventional ashes were reactive, and both standard and unconventional ashes showed a broad range of reactivity. Whether the ashes were Class C or Class F had a much more pronounced effect on their reactivity than whether they were standard or unconventional. This is not to say that conventional or unconventional did not make a difference. Indeed, close inspection of the reactivity curves suggested that coarse ashes (L, S), high SO3 ash (G), and the CFB ash (C) showed somewhat different reactivity than other tested materials. Overall, the relationship between fineness and reactivity was complex, but ashes showing the lowest fineness (most coarse) generally showed the lowest reactivity. Nevertheless, because many factors affect reactivity, standard coal ashes, which

are not low-fineness, could have similar reactivity to low-fineness unconventional coal ash (as an example, F vs. L).
Reactivity was best explained by chemical composition. The R3 test has additional sulfates and carbonates that react with calcium-bearing and alumina-bearing phases, forming sulfoaluminate and carboaluminate phases. This becomes important in the Class C ashes, which tend to have more of these phases and subsequently more of an associated reaction. Therefore, the R3 test shows much greater heat release for Class C than for Class F. The modified R3 test does not have additional sulfates and carbonates and no or limited sulfoaluminate and carboaluminate phase formation. The heat release is higher initially for Class C in the modified R3 test as the calcium-bearing phases react faster, but the Class F ashes catch up due to the slower but sustained reactivity of the aluminosilicate glass they contain. The initially-large-but-reducing-over-time differences in reactivity between Class C and Class F seen in the modified R3 test but not the R3 test are strikingly similar to strength gain behavior of these ashes when used in concrete, over a different timeframe.
The results support the assertion that Class F ashes show slow reactivity and could have a large potential for heat release after the 7 days in the R3 test. The complex reactivity behavior is controlled by the interplay between additional reactions and temperature, which have different effects for Class C and Class F ashes. Kinetic corrections or longer-term testing of reactivity could be useful to better understand the longer-term reactivity behavior. Because temperature affects reaction kinetics only, sulfates and carbonates that cause additional reactions could always dominate the temperature effect if testing were carried out for a longer period.
Calcium hydroxide consumption did not strongly depend on the choice of test. The systematic differences observed in the heat release were not seen in the calcium hydroxide consumption values, possibly because additional reactions with sulfates and carbonates responsible for generating greater heat release did not consume large amounts of calcium hydroxide. The higher heat release of Class F ashes and SF in the modified R3 test did not translate to higher calcium hydroxide consumption values, possibly due to varying reaction stoichiometries. As expected, for both testing schemes, the Class F fly ashes showed higher calcium hydroxide consumption than Class C fly ashes.
Bound water trends across the two tests were highly consistent with heat release trends, as shown in Figure 15. The modified R3 test shows a weaker heat-to-bound water correlation than the R3 test, with some outliers. The best fit line in this case did not pass through the origin, and small amounts

of bound water, 2–4 g/100 g SCM, showed zero heat release. Because the bound water test was done using a TGA, not a furnace, the values cannot be compared directly with those from the standard (expressed by mass of dry paste). However, as with other literature, a strong correlation between heat release and bound water was seen. The linear correlations between heat release and calcium hydroxide consumption, when removing slag, for both tests were somewhat weaker than the correlations shown in Figure 15. The three measurements are to a certain extent interchangeable since heat release, bound water, and calcium hydroxide consumption are all driven by the same reaction processes.
From this testing, the following approximate thresholds are suggested, which work for both tests for most materials: heat release 100 J/g SCM, or calcium hydroxide consumption 30 g/100 g SCM, or bound water 5 g/100 g SCM. The research team’s results from the R3 and modified R3 tests are in line with literature. Specifically, a heat release of between 50 and 100 J/g SCM and the equivalent bound water values should in most cases differentiate inert and reactive materials.
There was a strong linear correlation between the 3-day and 7-day/10-day heat release in the R3 and modified R3 tests. The 3-day heat release was 71% of the ultimate heat release for both tests, implying that the test duration could be reduced to 3 days for both tests for all materials except slow-reacting siliceous materials. Heat release, bound water, and calcium hydroxide consumption from the R3 test generally correlated with the modified R3 values over a range of materials, with exceptions as discussed.
Reactivity findings:
- Both R3 and modified R3 reactivity tests could differentiate reactive coal ashes from inert materials at a heat release threshold of approximately 100 J/g SCM.
- Both R3 and modified R3 tests showed that all standard and unconventional ashes were reactive and showed no perceivable differences in heat release.
- Low-fineness (coarse) ash, high-SO3 ash, and the CFB ash showed somewhat different reactivity than other tested materials. Specifically, the low-fineness (coarse) ashes generally showed lower reactivity.
- Both R3 and modified R3 tests showed that reactivity of the ashes was influenced by classes, i.e., Class C or Class F, more than by sources, although heat release was also shown to vary between the two tests.
- Common features include the notion of slow but sustained reaction kinetics of heat release for Class F ashes, and vice versa for Class C ashes, which manifested at early ages when Class C ashes generally generated higher heat release.
- Bound water trends across R3 and modified R3 tests were highly consistent with the heat release patterns.
- Calcium hydroxide consumption values were comparable between the R3 and modified R3 test results on the ashes.
- Correlations between heat release, calcium hydroxide consumption, and bound water for both R3 and modified R3 were also established to varying correlation coefficients.
- Results from the two reactivity tests showed that the proposed approximate thresholds to differentiate reactive materials from inert materials may be expressed as 100 J/g SCM for heat release, 30 g/100 g SCM for CH consumption, and 5 g/100 g SCM for bound water.
Paste Results
Calorimetry Results
Results from paste measurements were similar to those from powder characterization and reactivity. That is, whether ashes were Class C or Class F had a major impact on several properties, on average. Whether ashes were standard or unconventional did not have a strong effect on the properties, on average, although ashes with high LOI, high sulfate, and low fineness (coarse particles) exhibited properties different from other coal ashes. Table 24 summarizes the average value of various properties, expressed as a percentage of the control for Class F ashes, Class C ashes, and fillers.
All coal ashes reduced the peak heat flow to between 67% and 82% of the control, averaging 74% (see Figure 16). The coal ashes had slightly lower peak heat flow values than inert fillers, but no differences were found between Class C and Class F ashes. The 74% value is close to the 30% reduction predicted from pure dilution, though filler effect and hydration retardation can also influence the peak heat flow. As SO3 increased, the peak heat flow increased for Class C ashes, but not for Class F ashes, likely due to the presence of different forms of SO3. The time to peak heat flow values ranged from 82% to 162% of the control, averaging 117%. Most coal ashes retarded hydration when considering the time to peak heat flow, while inert fillers accelerated hydration. Class C ashes had on average longer time to peak than Class F ashes and the time to peak reduced linearly as ash SiO2 increased. The off-specification high-sulfate ash (G) had the most significant retarding effect.
Coal ashes reduced the 7-day heat release to 74–97% of the control, averaging 82%. The values are higher than the 70% expected from pure dilution due to filler effect, but not significantly due to
Table 24. Average value (%) of various properties compared to control for Class F coal ashes, Class C coal ashes, and fillers.
| Property | Class F | Class C | Filler | Cement |
|---|---|---|---|---|
| Peak heat flow | 73 | 75 | 77 | 100 |
| Time to peak heat flow | 109 | 133 | 85 | 100 |
| 7d Heat release | 79 | 91 | 81 | 100 |
| 7d Strength | 61 | 83 | 52 | 100 |
| 91d Strength | 83 | 85 | 59 | 100 |
| 7d Bulk resistivity | 81 | 83 | 86 | 100 |
| 91d Bulk resistivity | 286 | 154 | 85 | 100 |
| 7d Calcium hydroxide | 76 | 72 | 81 | 100 |
| 91d Calcium hydroxide | 64 | 65 | 82 | 100 |


low coal ash degree of reaction. Class C ashes averaged 91% of the control, whereas Class F ashes averaged 79% of control (see Figure 17). Heat release also increased linearly with CaO content, although there was obvious scattering (see Figure 18). The lowest heat release was observed in the low-fineness (coarse) off-specification Class F ash (L), which is unsurprising. None of the tested ashes showed a strong negative effect on cement hydration, and there was not an obvious worsening of performance with unconventional coal ashes.
Bulk Resistivity Results
At 7 days, bulk resistivity reduced to average values of 81%, 84%, and 86% of the control for Class F ashes, Class C ashes, and inert fillers, respectively (see Figure 19). This suggested low degree of reaction of the coal ashes at 7-day age. Corresponding bulk resistivity values at 91 days are 286%,

Figure 18. Moderate-strong correlations between CaO content and 7-day heat release (darker circles) and CaO content and 7-day strength (lighter rhombuses).

154% and 85% of the control, and the ashes, especially Class F ashes, increased greatly in bulk resistivity from 7 to 91 days. As shown at 91 days, significant differences were found in bulk resistivity between Class F ash, Class C ash, and inert fillers, with the tested ashes showing significant increases in bulk resistivity values. The increased resistivity is due to greater amounts of hydrates, denser microstructure, and greater alkali binding. There was not a good correlation between bulk resistivity and coal ash SiO2/CaO content, or whether the ash was unconventional or not. Bulk resistivity appears to be a promising method for distinguishing inert and reactive materials, as discussed in the “Modifications of SAI and Development of BRI” section.
At 7 days, coal ashes also reduced paste compressive strength to a range of 48–92% of the control. Class C ashes showed higher paste strength than Class F ashes at 7 days, consistent with the heat release results. As shown in Figure 18, 7-day strength also increased linearly with CaO content with moderate correlations and highlighted the higher degree of reaction of Class C ashes at this age. Class F ashes and inert fillers had similar 7-day strengths, showing that the use of SAI testing at 7 days could be problematic (see Figure 20). At 91 days, Class F and Class C ashes had similar strength, significantly higher than with inert fillers. From 7 to 91 days, Class F ashes showed 64% strength increase; other materials were < 35%, due to the slow but sustained reaction of the Class F ashes, as reflected in the modified R3 test results (Y. Wang, Ramanathan, et al. 2022a). Even at

91 days, coal ashes reduced strength compared to the control. While paste strength testing has a number of limitations, all coal ashes increased strength compared to inert materials, especially at later ages, showing the potential use of these ashes in concrete.
At 7 days, the four ashes with the lowest strength (48–55%) were P, S, B, and Q. At 91 days, only one ash (Q) had a strength of less than 75% of the control. While P was an in-specification ash, the rest were harvested and beneficiated, and/or had high LOI or low fineness (coarse particles). Therefore, in this case, at 7 days it appears that at least some unconventional ashes reduced strength. At 91 days most of the ashes showed acceptable strength, but the high LOI seemed to have a persistent effect in reducing the strength.
Calcium Hydroxide Results
All materials reduced calcium hydroxide content at 7-day age due to dilution and low degree of reaction, with average values of 81% for inert fillers, 76% for Class F ashes, and 72% for Class C ashes (Figure 21). At 91 days, corresponding values were 82%, 64%, and 65%. All ashes reduced calcium hydroxide content on the order of > 30%, showing ash reactivity compared to filler materials. The limited differences between ash types suggest that the greater pozzolanicity of Class F ashes may be overcome by the greater degree of reaction of Class C ashes. While unconventional ashes did not show major changes in the calcium hydroxide content, the lowest contents were observed for C, the unconventional CFB ash.
Among the unconventional coal ashes, only four showed properties that could be considered significant outliers. These included the CFB ash, the off-specification high-SO3 ash, the low-fineness (coarse) ash, and the high-LOI ash. While several off-specification ashes did show differences in properties compared to unconventional ashes, as a general rule, unconventional ashes did not result in paste properties substantially different from standard ashes. While these results suggest such ashes should be specified, durability testing is needed to determine the usage of these ashes in concrete.
The 7-day strength of the pastes showed a moderate correlation with the 1-day heat release in the R3 and modified R3 tests. At 91 days, the relatively similar strength of the coal ashes is in line with similar 10-day heat release from the modified R3 test but not the dissimilar values in the R3 test. The calcium hydroxide content in the 91-day pastes had a moderate negative correlation with the calcium hydroxide consumption in the R3 and modified R3 tests, which is promising as the calcium hydroxide content is related to various measures of durability. There was a positive exponential correlation between the 91-day paste bulk resistivity and the calcium hydroxide consumption in the modified R3 test, but not in the R3 test—important because the bulk resistivity is also a durability and quality control indicator.

Paste findings:
- Standard and unconventional ashes did not appear to have detrimental effects on cement hydration and strength development, producing pastes with similar later-age properties.
- Greater reactivity and better contribution to paste strength were observed in ashes than in filler materials, especially at 91-day age. However, strengths were still reduced in most ashes compared to the control mixture.
- CaO contents of the ashes influenced 7-day paste strength, 7-day heat release, and time to peak heat flow in established positive linear correlations.
- All standard and unconventional ashes showed substantial increases in bulk resistivity with age compared to inert fillers. These results implied that greater alkali binding, higher formations of hydration products, and more microstructure development occurred in the coal ash pastes.
- Overall, early- and later-age paste properties, including strength and BR, were effectively linked to heat release and calcium hydroxide consumption in the R3 and modified R3 tests, showing promising indicators of concrete durability.
- While unconventional ashes generally resulted in promising properties, low fineness (coarse particles), high SO3, and high LOI resulted in poor performance, at least for some properties.
Modifications of SAI and Development of BRI
This section discusses modifications to improve the SAI test by increasing the percentage of coal ash replacement to 30% or 50%, maintaining a constant w/cm, and curing at elevated temperatures as described in the “Reactivity and Paste Testing Methods” section. The BRI was also computed for these ashes.
At 30% replacement, 23°C, and 7 days, there were not significant differences in strength between the coal ashes and inert fillers (see Figure 22). The Class F coal ashes and the fillers both averaged

68% of the strength of the control due to the slow reactivity of the Class F ashes. At 28 days, the strength of the Class C ashes was 84% of the control, the strength of the Class F ashes was 80% of the control, and the strength of the inert fillers was 63% of the control. However, one coal ash showed an SAI of 74% and one inert filler showed a similar SAI of 73%. Combined with the high standard deviations and errors typically around 10%, these results highlight potential issues of the SAI test when using 7-day values.
At 50% replacement, 23°C, and 7 days, no distinction between Class F ashes and inert fillers was observed, with values clustered at 45% for the three tested materials (see Figure 23). Values were 46% for the Class F ashes, 87% for the Class C ash, and 51% for the inert fillers. At 28 days, all ashes had strengths > 50%, while inert materials had strength < 50%, with values of 60% for the Class F coal ashes, 88% for the Class C coal ash, and 48% for the inert fillers. However, the difference in strength between the weakest ash and strongest filler was < 10%, suggesting that differentiation of coal ashes and fillers using this test variant is possible but challenging.
At 30% replacement and 50°C curing, 7-day strengths were well differentiated between the ashes and inert fillers, with values being 105% for the Class F ashes, 110% for the Class C ash, and 64% for the inert fillers (Figure 24). Values at 28 days were 104%, 131%, and 74%, respectively. The weakest ash and the strongest filler showed a 16% difference at 7 days and a 25% difference at 28 days.
Results were similar for the 50% replacement level and 50°C curing (Figure 25). The 7-day strength values were 78% for the Class F ashes, 126% for the Class C ash, and 56% for the inert fillers. Values at 28 days were 91%, 101%, and 49%, respectively. The weakest ash and the strongest filler showed a 14% difference at 7 days and a 19% difference at 28 days.
These findings suggest that increasing the curing temperature is a promising modification to the current SAI test to better differentiate ashes and inert fillers, and may also be promising for natural pozzolans.
At 30% replacement, 23°C, and 7 days, the BRI values expressed as a percentage of the portland cement control did not show significant differences, clustering on average around 85% (see Figure 26). The values were 85% for the Class F ashes, 85% for the Class C ash, and 84% for the inert fillers. However, at 28 days the differences were substantial, with the values being 135% for the
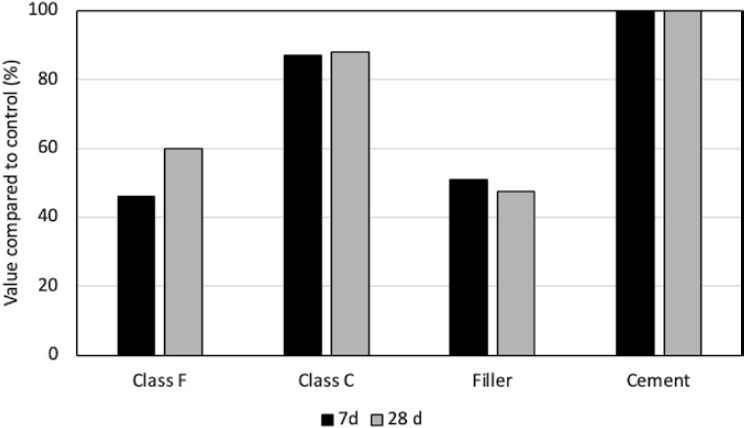

Figure 24. SAI (%) of coal ashes, fillers, and control at 30% replacement and 50°C.
Class F ashes, 117% for the Class C ash, and 83% for the inert fillers. The difference in value between the worst coal ash and best inert filler was about 34%, significantly larger than the typical error bars of less than 10%. This difference is also greater than the maximum differences seen with the SAI, suggesting the high selectivity of later-age BR measurements toward identifying reactive materials.
Results were somewhat worse for the 50% replacement level and 23°C curing (see Figure 27). The 7-day BRI values were 72% for the Class F ashes, 58% for the Class C ash, and 71% for the inert fillers. Values at 28 days were 142%, 81%, and 74%, respectively. At 7 days, fillers showed better results than the Class C ash. At 28 days, the worst coal ash and the best inert filler showed less than 5% difference, so this testing scheme would not be effective.
Results at 50°C curing, 30% replacement, and 7 days show a massive effect of the high-temperature curing in increasing the BRI for reactive materials (see Figure 28). The 7-day BRI

Figure 25. SAI (%) of coal ashes, fillers, and control at 50% replacement and 50°C.

Figure 26. BRI (%) of coal ashes, fillers, and control at 30% replacement and 23°C.
values were 394% for the Class F ashes, 221% for the Class C ash, and 81% for the inert fillers. Results at 28 days showed even greater differences for reactive and inert materials—1,013% for the Class F ashes, 364% for the Class C ash, and 93% for the inert fillers. Increasing temperature increases the reactivity of coal ashes, which is reflected in massive increases in their BRI. No significant effect is seen for inert fillers. The differences between the worst coal ash and best inert filler with the 50°C curing regime ranged from 100% to 1,400%, showing significant and easy distinction between the ashes and inert fillers.
Results at 50°C curing and 50% replacement are similar to those at 30% replacement at either age (see Figure 29). The 7-day BRI values were 1,279% for the Class F ashes, 515% for the Class C ash, and 78% for the inert fillers. Results at 28 days were 2,669% for the Class F ashes, 1,386% for the Class C ash, and 76% for the inert fillers. Significant and easy distinction was achieved between the ashes and inert fillers.

Figure 27. BRI (%) of coal ashes, fillers, and control at 50% replacement and 23°C.

Figure 28. BRI (%) of coal ashes, fillers, and control at 30% replacement and 50°C.
When observing the SAI and BRI data, it is apparent that from 7 to 28 days, SAI trends are inconsistent. That is, SAI for ashes increases on occasion, but not consistently. Likewise, for fillers SAI sometimes increases with age, but not always. Given that ashes react over time and fillers do not, the SAI test shows poor sensitivity to pozzolanic and hydraulic reactions. On the other hand, in every scenario tested, the BRI shows large increases from 7 to 28 days for ashes that are not seen for the fillers. These differences are magnified at high temperatures as seen in Figure 28 and Figure 29, again confirming the sensitivity of BRI to reactions.
In general, BRI increases were greater for Class F ashes due to their temperature sensitivity. Changes in BRI are driven by the rate of the coal ash reaction, pore solution pH, and pore connectivity. A BRI of 100% could be used to differentiate inert and reactive materials at 7 and/or 28 days. Based on these results, a scheme of increasing the curing temperature and measuring the BR is a promising alternative to SAI to better differentiate between coal ashes and inert fillers.
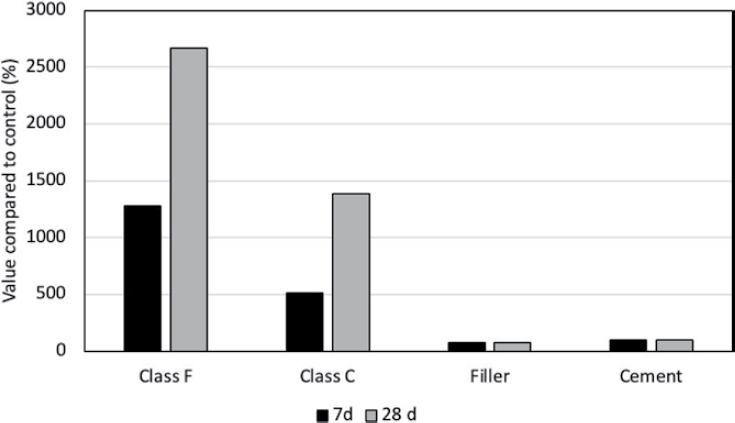
Figure 29. BRI (%) of coal ashes, fillers, and control at 50% replacement and 50°C.
This alternative may be promising for natural pozzolans as well. Using early-age BRI values at 1 and 3 days should also be considered in future testing.
BR and strength are inherently different measurements. Class C ashes show the best strength behavior, but Class F ashes show the greatest BR, at least at the tested ages. BR is far more sensitive to temperature than strength when comparing the differences in the numbers highlighted.
Heat release curves for all materials were remarkably similar at 23°C curing and 30% replacement due to the low degree of reactions at 7 days. This finding provides confirmation that the 7-day SAI does not measure reactivity and cannot be used to differentiate coal ashes from inert fillers. At 50% replacement, one coal ash showed higher heat release compared to the other four materials. At 50°C curing, coal ash pastes showed greater heat release than inert filler pastes. At both replacements, the Class C ash showed the highest heat release, followed by the Class F ashes, and then the inert materials. Heat release results are broadly in line with the SAI results and a positive correlation was found between 7-day SAI and heat.
At 7 days under 23°C curing, there was no significant difference in calcium hydroxide content for the coal ashes and filler materials at either replacement level. At 28 days, coal ash pastes showed reduced calcium hydroxide content, whereas the inert filler pastes showed increased calcium hydroxide content. In addition, at 28 days, calcium hydroxide content in coal ash pastes was significantly lower than the inert filler pastes. At 50°C curing, due to reaction acceleration, the coal ashes showed significantly lower calcium hydroxide content than inert fillers at both 7 and 28 days. Also, both coal ashes and inert fillers reduced calcium hydroxide from 7 to 28 days. This was anticipated for the coal ashes due to pozzolanic reaction kinetics consuming calcium hydroxide, but it is unclear why this is so for the inert fillers.
The bulk resistivity-calcium hydroxide consumption relationship appeared to be exponential/bilinear, with a threshold value beyond which the BR increased drastically. Although the amount of data is limited, it suggests the possibility of pore depercolation driving the increase in BR values. Further testing, including robustness, round-robin testing, and testing using more materials, should be considered for standardization of this test. However, a draft specification of the BRI method has been provided to AASHTO as Appendix 3.
SAI modification and BRI findings:
- Limited differences between coal ashes and fillers were found at 30% replacement and 23°C.
- Hydration and calcium hydroxide content measurements confirmed that there were limited differences between Class F ashes and inert fillers at 7 days.
- Increasing the replacement and especially the curing temperature to 50°C using SAI resulted in greater differentiation of 7- and 28-day SAI values between the coal ashes and filler materials.
- BR generally showed better differentiation of reactive coal ashes and inert materials.
- Accelerated curing at 50°C with both 30% and 50% replacement levels significantly increased BRI values for the coal ashes but not the inert fillers.
- The BRI test, especially at 50°C, is a promising modification that should be further explored.
- A draft specification of the BRI method has been provided to AASHTO as Appendix 3.
Mortar Testing Results
This section summarizes the results of mortar tests used to determine the strength contribution of the investigated ashes. These tests include (1) the standard compressive strength test with flow-adjusted SAI, (2) the KHI test using inert filler materials, and (3) the TSE using a higher cementitious content. MSAI results are in Appendix 5, which has been provided to AASHTO.
Strength Activity Index
Most of the coal ashes met the acceptable maximum water requirement to obtain a mortar flow within ±5% of the control flow. Only unconventional coal ashes C, S, and U showed water demands greater than the 105% water requirement limit. Water requirements for all tested coal ashes are shown in Figure 30. Most of the tested coal ashes have workability comparable to the control. For the tested coal ashes, particle fineness did not appear to play a significant role in water requirement.
Mortar SAI values from 7 to 91 days for the tested ashes are shown in Figures 31 and 32. Table 25 is provided for clarity of the SAI data. The 56-day data were interpolated from the measured 28- and 91-day data. Under the standard SAI test, most tested ashes generally showed a reduction in compressive strength compared to the control mixture at all ages. Exceptions include standard coal ash E (marginal SiO2 +Al2O3 +Fe2O3, elevated SO3) and unconventional ash J (cyclone collector ash) generating higher 7- and 91-day mortar strengths than the control, attributed to a combination of high CaO content and fineness of these ashes. Conversely, the lowest mortar strengths were observed for unconventional ashes L, M, and S, most notably due to their off-specification very coarse particle sizes. Increases in mortar strengths were generally observed for the tested ashes from 7 to 91 days. Class C ashes on average generated mortar strengths approximately 11% higher than Class F ashes at 7 days, illustrating the influence of CaO content to early-age strength development, as was also evident in paste studies. Similar to the cement paste data, by 91-day age, the contribution of CaO content diminished as mortar strengths between Class C and Class F ashes converged to comparable values. Higher increases in mortar strength compared to the control for the tested ashes, especially Class F ashes, suggested ongoing pozzolanic reaction over


Figure 32. Compressive strength and SAI (with 75% and 80% limits and 56-day interpolated strength).
Table 25. SAI of all ashes relative to the control.
| Mortar sample | SAI 7-day (% of control) | SAI 28-day (% of control) | SAI 56-day (% of control) | SAI 91-day (% of control) |
|---|---|---|---|---|
| Control | 100 | 100 | 100 | 100 |
| Standard Ashes | ||||
| A | 68 | 77 | 78 | 78 |
| D | 82 | 87 | 94 | 98 |
| E | 124 | 91 | 112 | 129 |
| F | 72 | 82 | 95 | 105 |
| H | 81 | 100 | 101 | 103 |
| I | 100 | 98 | 99 | 99 |
| P | 86 | 96 | 110 | 120 |
| Q | 79 | 84 | 92 | 98 |
| Unconventional Ashes | ||||
| B | 77 | 86 | 91 | 94 |
| K | 100 | 96 | 98 | 99 |
| M | 71 | 69 | 78 | 90 |
| N | 79 | 102 | 99 | 97 |
| O | 79 | 89 | 96 | 100 |
| R | 82 | 95 | 97 | 99 |
| S | 68 | 62 | 69 | 78 |
| C | 78 | 86 | 89 | 91 |
| G | 79 | 85 | 97 | 104 |
| J | 106 | 87 | 108 | 128 |
| L | 70 | 79 | 80 | 82 |
| T | 77 | 92 | 89 | 88 |
| U | 75 | 89 | 93 | 96 |
| V | 84 | 97 | 96 | 96 |
the 91-day period. This trend was consistent with several investigations involving coal ashes (Deschner et al. 2012, Jun-Yuan et al. 1984, Kondraivendhan and Bhattacharjee 2015, Narmluk and Nawa 2011, Sumer 2012).
Mortar strengths expressed as a percentage of the control strength on average generate SAI values greater than the 75% SAI limit for pozzolanic SCMs. Unconventional ashes L, M, and S, characterized by coarse particle sizes, generated 7- and 28-day SAI values below the 75% limit. This finding is broadly consistent with low reactivity and poor paste performance observed for some of the coarse coal ashes. At 56 days, with interpolated strengths expressed as SAIs, two of the off-specification fineness unconventional ashes M and S still had SAI values less than 75%, while the remaining off-specification fineness unconventional ash L passed the 75% SAI limit. By 91 days, all tested ashes showed significantly higher SAI values than the 75% limit. This confirms findings from reactivity testing that all ashes were indeed reactive and behaved differently to inert fillers.
Table 26 shows ashes that failed the different criteria of the SAI, including the standard 75% SAI limit at 7, 28, or 56 days. Only unconventional ash S, beneficiated by high heat treatment and with off-specification fineness (coarse particles), failed to meet the 75% limit at all tested ages. A proposed 80% SAI limit was also used to evaluate the performance of the ashes. Approximately 59% of all tested ashes and 71% of all unconventional ashes failed to pass the proposed 80% SAI
Table 26. Failure of ashes using different limits for SAI.
| SAI | Failed Ashes | |
| Limits | 75% | 80% |
| 7-day SAI | A, F, M, S, L, U | O, Q, G, N, C, B, T, U, F, M, L, A, S |
| 28-day SAI | M, S | L, A, M, S |
| 56-day SAI | S | M, A, S |
| 91-day SAI | None | A, S |
| 7-day and 28-day SAI | A, F, M, S, L, U | O, Q, G, N, C, B, T, U, F, M, L, A, S |
| 7-day or 28-day SAI | M, S | L, M, A, S |
| 7-day, 28-day, or 56-day SAI | S | M, A, S |
limit at 7 days. By 28 days, approximately 81% of all tested ashes passed the 80% SAI limit. The 80% SAI limit restricted the use of three unconventional ashes with off-specification fineness (L, M, and S) and a standard ash with low reactivity (A). At 56 days using interpolated strengths expressed as SAIs, the two off-specification-fineness ashes M and S and standard ash A still retained values below the 80% limit, while the remaining off-specification-fineness ash L barely passed the 80% SAI limit. The proposed 80% SAI limit was more conservative than the 75% SAI limit in restricting lower-reactivity ashes M, L, and A, as well as high-water-demand ash S.
Concerns of inert fillers passing the 75% SAI limit or false positives are often cited in the literature (Sutter et al. 2013, Suraneni et al. 2021), but none of the coal ashes tested here were found to be inert. As shown later in the Concrete Testing Results section, coal ashes M, L, and A all demonstrated adequate strength gain (although lower than the control) and very high BR compared to the control at later ages, indicating significant reaction. Ash S, on the other hand, had comparatively lower concrete strength and BR, but was still reactive. For this reason, requiring an 80% limit would likely restrict the use of viable ashes, especially slower-strength-gaining ashes, and is therefore not proposed as a change to the AASHTO M 295 standard.
MSAI results have been provided to AASHTO as Appendix 5. The use of MSAI with constant w/cm was found to be overly restrictive by failing certain reactive coal ashes.
Keil Hydraulic Index
The KHI results are shown in Figure 33 using nonconstant water (SAI) samples. On average, all inert materials (limestone, basalt, and quartz) showed little contribution to mortar strength at all ages when compared to the investigated ashes. There were several exceptions at various ages when a coal ash appeared to show lower strength contributions or smaller KHI values than the inert fillers, including negative KHI values for ashes S, L, and M at 7 days using inert quartz, ash M at 28 days using basalt and quartz fillers, and ash S at 28 days using all three inert filler materials. Standard high-LOI ash F and standard ash A also showed comparable or lower strength contributions than inert quartz at 7 days by generating very low to negative KHI values, respectively. M, S, and L were unconventional ashes that were characterized by off-specification fineness or very coarse particle sizes that may have reduced their reactivity and hindered their strength contribution at the ages of 7 and 28 days. Thus, KHIs using each of the inert fillers were able to catch these behaviors, implying that for these ashes most of the early-age strength gains were likely indicative of slower and lower pozzolanic reactivity. Similar behaviors were observed in the Reactivity Results, Paste Results, and Concrete Testing Results sections of this report where two of these ashes (S and L) were shown to generally generate lower strengths. KHI using quartz also successfully identified standard ashes F and A as lower pozzolanic ashes in the early age of 7 days, which accords with the strength results shown in the Strength Activity Index section of this report. Also, coal ash A was shown to have lower reactivity and to generate one of the lowest concrete strengths from 28 to 91 days.
One interesting feature of the KHI test was that it clearly showed the inertness of the filler materials over time, especially at 28 and 91 days, when their KHI values were significantly less than those of the coal ashes: 51–72% lower at 28 days and 79–121% lower at 91 days. This finding is similar to the BRI, which shows no significant increase in inert filler properties over time. Inert fillers were also clearly differentiated from the hydraulic behaviors of the cement control at both 28- and 91-day ages, generating KHI values approximately 89% to 110% less than the control. These findings on the assessment of the contribution of strength using KHI appeared to circumvent the issue of false positives in classifying inert fillers as pozzolanic SCMs, a finding consistent with Sutter et al. (2013).
The results also showed KHI values increasing with age when the coal ashes were used as the test mixtures. Among the inert fillers, it was generally shown in the KHI results that quartz generated the highest contribution to strength, while limestone generated the lowest contribution to strength.

This is somewhat unexpected, since secondary reactions with limestone are known to occur, and do not happen in quartz. Since these materials were considered inert or nonpozzolanic or at least of limited reactivity, such contributions or perceived contributions to strength likely stemmed from filler effects due to particle sizes and particle packings. Closer inspections of the data also revealed that by 91 days of testing, KHI values for the coal ashes ranged from approximately 90% to 110% compared to the 100% control datum, suggesting strength contributions of all ashes were at worst comparable to the control and at best exceeding it. When comparing by source, it was shown that 28- and 91-day KHIs of standard ashes exceeded those of unconventional ashes by approximately 15% and 20%, respectively.
Individually, coal ashes S (unconventional, beneficiated by heat treatment), A (standard), and L (unconventional) also generated the lowest 91-day KHIs across all inert fillers used. The highest 91-day KHIs were measured for coal ashes E (standard) and J (unconventional, cyclone collector ash). It should be noted that S, A, and L were also among the ashes that generated some of the lowest later-age mortar and concrete strengths while ashes E and J yielded some of the highest mortar strengths, as discussed in the Strength Activity Index section. Interestingly, ash J (Class F) generated the highest concrete strengths from 28 to 180 days, whereas ash E (Class C) generated some of the lowest concrete strengths and BRs from 28 to 180 days, as discussed in the Concrete Testing Results section, indicating that early-age KHI testing might not predict later-age behavior for certain high-calcium coal ashes.
Overall, a trend of increasing KHI values with curing ages for all the investigated coal ashes was found, implying ongoing pozzolanic reactivity or increasing contributions to strength development. This test also allowed for better differentiation of strength contribution between the filler effect of inert materials and pozzolanic reactivity of the ashes, which may provide an alternative solution to the issue of false positives of inert fillers passing as pozzolanic SCMs. However, in this investigation, the effect of water reduction remained unclear—especially in the SAI regime—and there was a drawback regarding the variabilities measured for compressive strengths. Further refinements of the KHI are recommended, although results shown in this investigation suggested that their use may be more viable than the traditional SAI tests alone and more economical than certain direct reactivity tests.
Total Efficiency Test
The results of the TE tests are shown in Figure 34. The test results indicated that filler materials did not contribute much to strength development as demonstrated by the various negative values attained for the CE, WRE, and overall TSE. Higher efficiencies (TSE, CE, and WRE) were observed for ashes A, D, and R in comparison to the control at both 7 and 28 days. By 28 days, ash R had the highest TSE, which is likely related to its higher SAI strength. Furthermore, R showed a significant increase in CE from 7 to 28 days, indicating that it was more chemically reactive than ashes A and D. Yet this finding is not supported by R3 testing where D had the highest reactivity. Ash A had the highest WRE, indicating that it had the most significant contribution to strength due to water reduction, which may be a result of its lower water requirement. Ashes A and R also exhibited negative CE values, which would indicate that their CEs contributed a negative effect to the overall TSE. The inert fillers, especially basalt and quartz, showed significant decreases in efficiencies (including negative values) from 7 to 28 days.
These results were tested for repeatability two additional times. Unfortunately, the measured efficiencies for the same tested ashes were up to 575% different between trials, with TSE and CE values fluctuating the most. Some of the efficiency values even fluctuated between positive and negative from trial to trial. This caused concern regarding repeatability of the test and uncertainties in interpretation of the results. These inconsistencies prompted discontinuation of the TE test. Although the ability to differentiate between strength contributions from chemical reactions and water reduction could be useful, the results of this test were deemed less meaningful relative to other aspects of reactivity tests, including R3 to directly assess reactivity, SAI to determine water requirements that can be controlled in concrete by admixtures, and KHI to directly compare coal ash performance to inert fillers.

BR Measurement of SAI
Bulk resistivity measurements taken for the SAI mortar cubes are shown in Figure 35 and Table 27 to provide clarity in the measured values. Generally, there was an exponentially increasing trend in BR values from 3 to 91 days similar to that seen in paste testing. Considerable increases in BR values were shown at 56- and 91-day ages when more than 95% of all coal ashes generated BR values greater than the control mortar, indicating pozzolanic reactivity or pore refinement over time, consistent with reactivity and paste bulk resistivity results. The one unconventional ash that did not meet SAI limits, S, also showed low BR values at all ages.

Table 27. Bulk uniaxial resistivity expressed as a percentage of the control mixture (SAI scheme).
| Samples | BR3-day (% of control) | BR7-day (% of control) | BR28-day (% of control) | BR56-day (% of control) | BR91-day (% of control) |
|---|---|---|---|---|---|
| Control | 100 | 100 | 100 | 100 | 100 |
| Standard Ashes | |||||
| A | 88 | 87 | 95 | 138 | 206 |
| D | 90 | 93 | 114 | 134 | 167 |
| E | 114 | 113 | 120 | 160 | 224 |
| F | 90 | 91 | 106 | 156 | 407 |
| H | 106 | 110 | 110 | 206 | 190 |
| I | 112 | 114 | 141 | 125 | 307 |
| P | 81 | 82 | 105 | 204 | 351 |
| Q | 80 | 78 | 92 | 124 | 135 |
| Unconventional Ashes | |||||
| B | 72 | 75 | 132 | 174 | 310 |
| K | 124 | 115 | 129 | 145 | 296 |
| M | 84 | 80 | 109 | 156 | 252 |
| N | 80 | 84 | 104 | 145 | 187 |
| O | 83 | 76 | 89 | 106 | 172 |
| R | 92 | 90 | 109 | 232 | 409 |
| S | 85 | 78 | 86 | 105 | 119 |
| C | 85 | 98 | 144 | 187 | 354 |
| G | 87 | 84 | 100 | 111 | 140 |
| J | 80 | 86 | 90 | 116 | 137 |
| L | 84 | 87 | 108 | 171 | 345 |
| T | 79 | 75 | 92 | 126 | 205 |
| U | 97 | 91 | 116 | 159 | 187 |
| V | 96 | 89 | 122 | 184 | 242 |

Figure 36 shows the comparison in BR values between all ashes and the control at different ages for SAI samples. ANOVA at the 5% confidence level and Tukey-Kramer pairwise analyses were used to differentiate BR values at 91 days with respect to the control for the SAI data. For SAI at 91 days, significant differences were identified between standard and unconventional coal ashes on average, which were higher compared to the control mortar (p-values = 0.000). The differences were less pronounced at earlier ages. One potential modification to the specification could be to simultaneously measure strength and BR on the SAI samples to better differentiate reactivity of the ashes. Modifications as suggested earlier including higher percentage replacement of cement with the ash and higher curing temperatures could exaggerate the effects for better differentiation.
Mortar findings:
- Except for one unconventional coal ash with off-specification fineness (coarse particles), the remaining coal ashes generated SAI values greater than the 75% limit by 56 days, and all coal ashes generated SAI values exceeding the 75% limit by 91 days.
- A proposed 80% SAI limit and use of MSAI with constant w/cm were found to be overly restrictive by failing reactive coal ashes.
- For SAI samples, BR increased with age. By 91 days, BR values on average were significantly higher for the coal ashes compared to the control mixture. This indicates it may be a better measurement of coal ash reactivity than strength measurements alone.
- KHI detected low indices for off-specification-fineness and low-reactivity ashes and very low indices for filler materials, circumventing concerns of false-positive classification of inert fillers as reactive SCMs. It may be a good future alternative to using SAI in the AASHTO M 295 standard due to its ability to better differentiate reactivity.
- TE test results were inconsistent based on repeatability studies and inconclusive compared to other reactivity tests, so TE testing was discontinued.
Concrete Testing Results
This section summarizes the results of concrete tests for important fresh and hardened properties, electrical properties, and durability performance of the investigated ashes. Tests for fresh and hardened concrete properties include (1) the standard test for slump, density, and air content of fresh concrete and (2) the standard test for hardened concrete compressive strength. Durability tests include (1) the tests to determine electrical properties of hardened concrete using bulk uniaxial resistivity and surface resistivity measurements of hardened concrete and (2) the RCPT for performance against deleterious chloride ingress.
Fresh Concrete Properties
Fresh concrete properties including slump, air content, density, and 90-minute slump decrement of the tested ashes are shown in Table 28. Generally, inclusion of the ashes improved workability and increased the slump of fresh concrete compared to the cement control mixture. Numerically, 68% of the tested ashes improve concrete workability, 23% reduced workability, and 9% showed no difference in workability. This was anticipated since many of the ashes were characterized via SEMs with morphologies consisting mainly of spherical particles similar to standard ashes. Compared to the control, Class C ashes increased concrete workability measured by slump by approximately 50% in contrast to the 29% increase shown for Class F ashes. This was not anticipated since Class C ashes on average were finer than Class F, so other factors likely controlled.
In terms of ash sources, standard ashes increased concrete workability (or slump) by 59% compared to the control, while for unconventional ashes the increase in workability was about 20%. Several unconventional ashes (C, S, U, J, and V) also clearly reduced workability of fresh concrete, likely due to their morphologies consisting of irregular or angular-shaped particles, particularly
Table 28. Fresh concrete properties of various concrete mixtures.
| Samples | Slump S (inch) | Density D (pcf) | Theoretical Density T (pcf) | Measured Air Content Acorr (%) | Theoretical Yield Yt (yd3) | Actual Yield Y (yd3) | Relative Yield Y/Yt (%) |
|---|---|---|---|---|---|---|---|
| Control | 3.00 | 151.6 | 152.3 | 0.8 | 26.5 | 26.6 | 100 |
| Standard Ashes | |||||||
| A | 5.25 | 150.0 | 150.5 | 1.0 | 26.5 | 26.5 | 100 |
| D | 4.75 | 151.8 | 151.2 | 0.3 | 26.5 | 26.4 | 100 |
| E | 7.75 | 150.6 | 151.6 | -0.1 | 26.5 | 26.6 | 101 |
| F | 3.25 | 144.6 | 150.7 | 0.1 | 26.5 | 27.6 | 104 |
| H | 3.50 | 152.6 | 151.7 | 0.2 | 26.5 | 26.3 | 99 |
| I | 6.50 | 151.2 | 151.0 | 0.5 | 26.5 | 26.4 | 100 |
| P | 3.00 | 150.8 | 150.9 | 0.1 | 26.4 | 26.5 | 100 |
| Q | 4.25 | 151.6 | 150.5 | 0.1 | 26.5 | 26.3 | 99 |
| Unconventional Ashes | |||||||
| B | 3.50 | 150.0 | 148.5 | 0.7 | 26.5 | 26.2 | 99 |
| K | 4.75 | 152.6 | 151.7 | 0.1 | 26.5 | 26.3 | 99 |
| M | 4.25 | 151.4 | 150.7 | 0.1 | 26.5 | 26.3 | 100 |
| N | 7.00 | 150.6 | 151.0 | 0.5 | 26.5 | 26.5 | 100 |
| O | 3.50 | 151.2 | 150.7 | 0.1 | 26.5 | 26.4 | 100 |
| R | 4.00 | 151.6 | 150.8 | 0.1 | 26.5 | 26.3 | 99 |
| S* | 3.00 | 150.2 | 150.4 | 0.7 | 26.4 | 26.5 | 100 |
| C* | 3.00 | 151.0 | 151.2 | 0.5 | 26.5 | 26.5 | 100 |
| G | 3.25 | 151.6 | 151.3 | 0.4 | 26.5 | 26.4 | 100 |
| J | 2.00 | 153.8 | 151.6 | 1.1 | 26.5 | 26.1 | 99 |
| L | 3.00 | 148.4 | 147.9 | 0.3 | 26.5 | 26.4 | 100 |
| T | 3.50 | 151.8 | 151.0 | 0.1 | 26.5 | 26.3 | 99 |
| U* | 3.00 | 150.6 | 150.6 | 0.4 | 26.5 | 26.5 | 100 |
| V | 2.75 | 152.0 | 150.2 | -0.1 | 26.3 | 26.1 | 99 |
*Glenium 300 superplasticizer was added in increments of 20 mL until adequate workability was achieved. Total amounts of superplasticizer used in coal ashes C, S, and U were 150 mL, 30 mL, and 100 mL, respectively.
unconventional ashes C, S, and U. In addition, unconventional ashes C, S, and U, which displayed high water demands of more than 105% in mortars, had such poor workability and inadequate consistency for molding that additions of Glenium 300 superplasticizers were required to achieve the targeted slump range of 2 to 5 in. The cyclone collector ash J generated a slump on the lower side of only 2 in. yet displayed adequate workability for molding. The morphology of this particular ash, most notably its particles of various small and large plerospheres and small-size irregular shapes, likely contributed to the behavior shown.
After 90 minutes of mixing, wet concrete made with the ashes indicated an average reduction in workability or slump of approximately 62% compared to the initial slump measurement. About half of the tested ashes retained better workability than the control, on average generating higher 90-minute slump with values ranging from 1.5 to 2.25 in. Excessive 90-minute slump decrements of at least 75% were observed for several unconventional ashes, including B, C, S, U, and J, which made molding of the concrete specimens difficult. This behavior can be attributed to their morphologies consisting of a combination of either angular and agglomerated particles or coarseness having a negative effect on the plastic concrete workability. In the field, these ashes may be quite difficult to pump or finish per ASTM C94 if not cast within a 90-minute timeframe and would need admixtures to be workable for longer periods of time.
In terms of class, Class C ashes improved 90-minute workability by 57% while Class F ashes improved workability by 11% compared to the control. By source, standard ashes increased 90-minute slump by 50% compared to the control concrete, whereas unconventional ashes generated only a 9% increase in 90-minute slump.
Overall, regardless of class and source, most investigated coal ashes showed workability comparable to fresh concrete using commercial standard coal ashes and retained similar 90-minute workability. Caution should be taken on an individual basis to safeguard against ashes that exhibited workability issues, notably unconventional ashes C, S, U, J, and B.
In this investigation, air content of fresh concrete ranged from 0.1% to 1.0% for the coal ash mixtures, which included application of the aggregate correction factor G of 0.27% using ASTM C231. These values are very low and were attributed to mechanical errors induced by the testing equipment, as well as potential human errors in overpacking the fresh concrete into the mold prior to sealing. Most tested ashes fell below the typical 1–2% entrapped air range of freshly mixed non-air-entrainment concrete. AEA dosage testing in concrete is discussed in a later section. All other fresh properties, such as yields and densities, showed comparable values among the ashes by class and source and with respect to the control concrete mixture.
Hardened Concrete Properties
Figures 37 and 38 show the compressive strength evolution of hardened concrete made with tested coal ashes at various curing ages. Table 29 provides further clarity for the values presented in Figure 37. One notable feature was the high concrete strengths generated by several unconventional ashes, including cyclone collector ash J, CFB ash C, surfactant-treated ash K, and blended ash N, over the 180-day testing period. Conversely, low concrete strengths were also observed for unconventional off-specification ash L and for reclaimed heat-treated ash S throughout the testing period. Unconventional ashes J and N had no off-specification physicochemical properties, while C and K were marked by high CaO and SO3 contents. Unconventional ashes S and L, which also generated low mortar strengths, were both characterized by off-specification fineness or extreme coarseness and high water demands in excess of 100%. Only ash S did not pass the 75% SAI limit at specified ages. Standard ash E with marginal sum of oxides, high calcium content (Class C), and high SO3 and standard ash A with normal Class F properties also had lower concrete strengths from 28 to 180 days. This highlights that in-specification coal ashes do not always generate high strength compared to a control even at later ages.


Table 29. Compressive strength expressed as a percentage of control concrete mixture.
| Concrete Sample | 1-day f'c (% of control) | 7-day f'c (% of control) | 28-day f'c (% of control) | 91-day f'c (% of control) | 180-day f'c (% of control) |
|---|---|---|---|---|---|
| Control | 100 | 100 | 100 | 100 | 100 |
| Standard Ashes | |||||
| A | 61 | 66 | 81 | 81 | 83 |
| D | 67 | 88 | 110 | 109 | 105 |
| E | 75 | 82 | 83 | 87 | 91 |
| F | 72 | 80 | 85 | 99 | 93 |
| H | 73 | 114 | 113 | 108 | 112 |
| I | 64 | 76 | 86 | 94 | 94 |
| P | 65 | 77 | 89 | 105 | 96 |
| Q | 55 | 75 | 79 | 90 | 84 |
| Unconventional Ashes | |||||
| B | 70 | 68 | 83 | 93 | 92 |
| K | 98 | 102 | 112 | 113 | 115 |
| M | 61 | 72 | 80 | 84 | 94 |
| N | 64 | 93 | 103 | 106 | 110 |
| O | 72 | 75 | 89 | 99 | 95 |
| R | 62 | 67 | 78 | 91 | 92 |
| S | 61 | 70 | 72 | 77 | 80 |
| C | 92 | 100 | 111 | 100 | 108 |
| G | 69 | 89 | 93 | 102 | 108 |
| J | 80 | 112 | 119 | 124 | 124 |
| L | 65 | 70 | 75 | 94 | 87 |
| T | 66 | 69 | 78 | 94 | 89 |
| U | 64 | 75 | 85 | 91 | 89 |
| V | 59 | 75 | 82 | 96 | 104 |
When concrete strengths were expressed as a percentage of the control, there were generally substantial increases in strength over time for the ashes relative to changes in the control strength especially after 7 days of curing. At the early age of 1 day, the tested ashes generated concrete strengths approximately 70% of the control. By 28 days, only five coal ashes (L, Q, R, S, and T) generated concrete strengths below 80% of the control. An ANOVA at a 5% confidence level and a Tukey-Kramer post hoc pairwise analysis were performed to differentiate between strength contributions of the tested ashes. No statistically significant differences were identified for concrete strength on average comparing standard and unconventional ashes at 180 days. Class C ashes on average generated 180-day strengths 12% higher than Class F ashes. Overall, all unconventional ashes used in this study showed contributions to strength development. However, certain unconventional ashes primarily with coarse particles and certain standard coal ashes with a range of contributing factors had reduced strength at later ages compared to the control.
Concrete Durability
Bulk and Surface Resistivity and Rapid Chloride Permeability Results
BR and SR values of the concrete specimens were measured over 180 days of curing and are shown in Figures 39, 40, 41, and 42. Tables 30 and 31 provide clarity for the data in Figures 39 and 41, respectively. Like the paste and mortar results, most ashes generated reduced BR and SR values at the early ages of 1 and 7 days compared to the control concrete. However, a few of the ashes, notably standard ash H and unconventional ashes C (CFB ash) and J (cyclone collector ash), indicated resistivity values greater than the control at 7 days. After 28 days of curing, most of the ashes showed increased resistivity values compared to the control concrete. All ashes regardless of source and class, per AASHTO TP 119-15 BR and AASHTO T358 SR criteria, produced concrete samples with moderate to high chloride ion penetrability (CIP) ratings at 28 days. By 91-day age, resistivity values in all ash samples were significantly greater than those of the control concrete, a finding consistent with the literature using a smaller dataset (Rashad 2015). Unconventional ash B (off-specification, beneficiated by milling/sieving) and standard ash E (marginal SiO2 +Al2SO3 + Fe2O3, high CaO, and elevated SO3) generated the highest and lowest 91-day values, respectively, matching with an earlier paste investigation (Y. Wang, Acarturk, et al. 2022). Similar behaviors in these two ashes (B and E) were also observed for 91-day SR measurements; unconventional ash V (bottom ash blend, no off-specification properties) also generated very high SR relative to the remaining coal ashes. Standard errors of the resistivity measurements also increased significantly around this age and showed substantial data dispersion likely due to saturation effects due to wet curing over time. At 91 days of curing and beyond, all coal ashes generated concrete with resistivity values approximately 2 to 4 times greater than the control concrete.
ANOVA at the 5% confidence level and Tukey-Kramer post hoc pairwise analyses were used to quantify differences in 28- and 180-day concrete BR values by ash source and class. The results showed no statistically significant differences in BR values between Class C and Class F ashes on average at 28 days (average p-value = 0.113) compared to the control concrete; however, statistically significant differences in BR values were identified for Class C and Class F ashes at 180 days of curing compared to the control (average p-value = 0.002). Specifically, Class C and F ashes generated 180-day BR values 120% and 290% greater than the control, respectively. Interestingly, pairwise comparisons at 28 days showed that on average unconventional ashes generated statistically higher BR values than standard ashes (p-value = 0.011). At 180 days, unconventional and standard ashes had statistically similar BR values up to 255% greater than the control concrete. In principle, higher BR values typically indicate more C-A-S-H (calcium aluminate silicate hydrates) gel formations and greater alkali-binding capabilities, and so concrete specimens made with the investigated ashes likely yielded higher volumes of hydration products and more microstructurally refined concrete specimens.


From a performance perspective, all investigated ashes regardless of source or class produced concrete samples with very low to low 180-day BR rating per AASHTO TP 119-15. Per AASHTO T358, 180-day SR ratings of low to moderate were also observed for all investigated ashes. Overall, all tested unconventional and standard ashes were reactive and contributed to microstructure development and strength. These conclusions match those from reactivity, mortar, and paste tests.
To measure durability performance of concrete with respect to deleterious chloride ingress, the RCPT was used in combination with BR, electrical charge passage, and penetration depth measurements performed on the same concrete disk specimens at 28 and 91 days (ASTM C1202, NT Build 492 1999). The results of RCPT-related measurements are shown in Table 32, and their implications on concrete durability are described here. The BR measurements of the concrete disks showed similar results to the BR measurements shown earlier on the full concrete cylinders. Indications of chloride ion penetrability based on electric charge passage measurements showed comparable results to the measured disk BR values. Specifically, at 28 days of curing, standard and unconventional ashes reduced charge penetration into the concrete disk specimen by as much as 27% and 40%, respectively, compared to the control. At 91-day age when significant pore refinement had occurred and BR values became substantially high, most of the investigated ashes generated very low to low CIP performance ratings. Only a few ashes showed moderate CIP ratings (E, K, S, and G), while the control concrete maintained a high CIP rating. Statistically, standard and unconventional ashes generated concrete with comparable charge passage, but also reduced charge passage by as much as 65% and 69% compared to the control concrete. It should be noted that the few coal ashes with moderate CIP rating with respect to charge passage measurement were ashes that either generated lower concrete strengths, lower R3/MR3 reactivity, or some of the lowest electrical resistivity values shown in previous sections. Overall, reductions in charge penetration over time, or progressive increases in BR, occurred in all concrete specimens, reinforcing ongoing pozzolanic reactivity and pore refinement throughout the testing period for concrete produced from the investigated ashes.

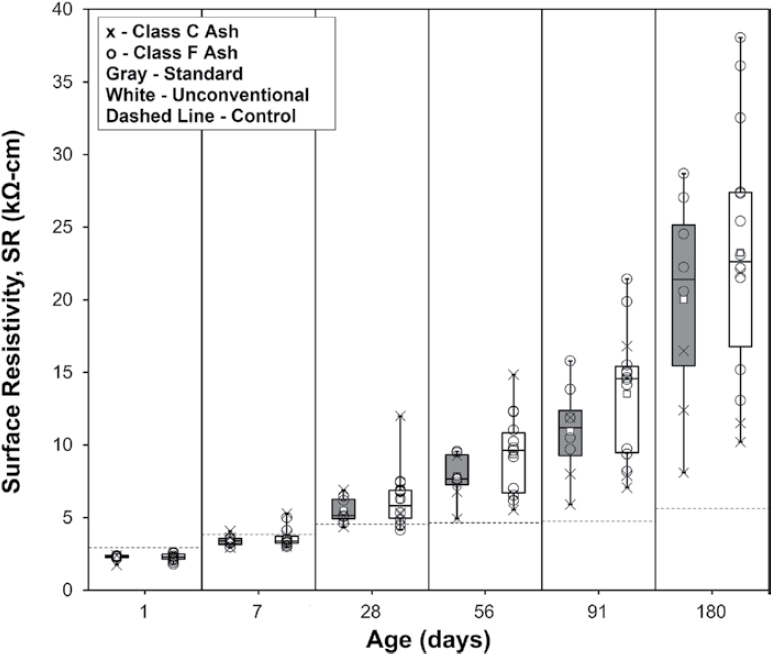
Table 30. BR of concrete expressed as a percentage of the control.
| Concrete Sample | BR1 (% of control) | BR7 (% of control) | BR28 (% of control) | BR56 (% of control) | BR91 (% of control) | BR181 (% of control) |
|---|---|---|---|---|---|---|
| Control | 100 | 100 | 100 | 100 | 100 | 100 |
| Standard Ashes | ||||||
| A | 71 | 74 | 104 | 158 | 208 | 378 |
| D | 82 | 100 | 129 | 196 | 234 | 269 |
| E | 67 | 78 | 88 | 115 | 113 | 146 |
| F | 78 | 89 | 101 | 161 | 202 | 347 |
| H | 83 | 108 | 113 | 141 | 171 | 211 |
| I | 79 | 88 | 129 | 202 | 270 | 442 |
| P | 84 | 89 | 133 | 196 | 279 | 436 |
| Q | 65 | 79 | 97 | 133 | 171 | 233 |
| Unconventional Ashes | ||||||
| B | 84 | 97 | 134 | 253 | 361 | 494 |
| K | 76 | 90 | 106 | 130 | 147 | 191 |
| M | 74 | 83 | 133 | 206 | 273 | 426 |
| N | 87 | 93 | 162 | 202 | 252 | 360 |
| O | 82 | 85 | 101 | 154 | 214 | 366 |
| R | 78 | 80 | 88 | 151 | 207 | 347 |
| S | 84 | 83 | 85 | 121 | 140 | 197 |
| C | 89 | 129 | 247 | 294 | 304 | 325 |
| G | 70 | 76 | 104 | 124 | 144 | 177 |
| J | 79 | 129 | 163 | 231 | 258 | 357 |
| L | 92 | 87 | 115 | 186 | 278 | 520 |
| T | 71 | 76 | 106 | 201 | 273 | 412 |
| U | 75 | 88 | 142 | 208 | 283 | 393 |
| V | 75 | 85 | 143 | 257 | 357 | 535 |
Table 31. SR of concrete expressed as a percentage of the control.
| Concrete Sample | SR1 (% of control) | SR7 (% of control) | SR28 (% of control) | SR56 (% of control) | SR91 (% of control) | SR181 (% of control) |
|---|---|---|---|---|---|---|
| Control | 100 | 100 | 100 | 100 | 100 | 100 |
| Standard Ashes | ||||||
| A | 79 | 84 | 111 | 165 | 221 | 366 |
| D | 82 | 94 | 152 | 199 | 251 | 293 |
| E | 59 | 77 | 96 | 106 | 124 | 144 |
| F | 79 | 91 | 101 | 160 | 204 | 396 |
| H | 82 | 106 | 113 | 146 | 169 | 221 |
| I | 74 | 93 | 136 | 206 | 292 | 481 |
| P | 78 | 86 | 143 | 204 | 333 | 510 |
| Q | 62 | 84 | 100 | 141 | 198 | 270 |
| Unconventional Ashes | ||||||
| B | 88 | 89 | 149 | 265 | 419 | 677 |
| K | 73 | 99 | 115 | 142 | 167 | 205 |
| M | 66 | 89 | 139 | 207 | 316 | 488 |
| N | 88 | 107 | 165 | 221 | 309 | 411 |
| O | 82 | 77 | 112 | 164 | 250 | 436 |
| R | 81 | 80 | 98 | 151 | 205 | 383 |
| S | 81 | 86 | 91 | 133 | 172 | 233 |
| C | 86 | 137 | 264 | 320 | 354 | 389 |
| G | 74 | 79 | 117 | 119 | 149 | 181 |
| J | 80 | 130 | 163 | 237 | 298 | 394 |
| L | 86 | 85 | 117 | 198 | 318 | 579 |
| T | 70 | 78 | 107 | 208 | 327 | 486 |
| U | 78 | 84 | 152 | 211 | 306 | 452 |
| V | 75 | 91 | 151 | 266 | 452 | 643 |
Table 32. Concrete rapid chloride penetrability test results.
| Concrete Samples | 28-day | 91-day | ||||
|---|---|---|---|---|---|---|
| Disk Bulk Resistivity (kΩ-cm) | Adjusted Charge (C) | Penetration Depth (mm) | Disk Bulk Resistivity (kΩ-cm) | Adjusted Charge (C) | Penetration Depth (mm) | |
| Control | 4.9 | 6,108.5 | 27.6 | 5.3 | 4,670.1 | 25.7 |
| Standard Ashes | ||||||
| A | 5.2 | 4,797.0 | 39.1 | 11.6 | 1,421.3 | 8.2 |
| D | 9.2 | 2,788.5 | 25.4 | 17.0 | 1,372.6 | 10.2 |
| E | 4.1 | 6,835.0 | 36.9 | 8.3 | 3,119.4 | 22.9 |
| F | 4.9 | 4,882.1 | 42.6 | 12.8 | 1,545.5 | 14.1 |
| H | 5.7 | 4,764.7 | 22.6 | 15.5 | 1,972.5 | 13.9 |
| I | 7.0 | 3,927.4 | 27.7 | 18.6 | 1,174.0 | 6.6 |
| P | 6.9 | 4,162.0 | 33.7 | 17.6 | 1,069.9 | 8.1 |
| Q | 5.6 | 4,873.4 | 36.6 | 13.7 | 1,691.5 | 9.4 |
| Unconventional Ashes | ||||||
| B | 8.3 | 3,492.2 | 29.9 | 28.3 | 700.0 | 4.3 |
| K | 6.8 | 4,054.8 | 27.0 | 8.8 | 2,415.1 | 16.4 |
| M | 8.5 | 3,970.3 | 29.7 | 15.1 | 1,324.0 | 9.2 |
| N | 10.8 | 2,768.8 | 20.1 | 15.6 | 1,340.4 | 9.9 |
| O | 5.1 | 5,390.2 | 42.7 | 10.3 | 1,980.1 | 14.3 |
| R | 5.2 | 4,541.0 | 33.9 | 18.0 | 1,407.0 | 9.4 |
| S | 5.9 | 3,845.2 | 36.5 | 13.4 | 2,133.2 | 18.8 |
| C | 13.3 | 1,551.0 | 11.4 | 19.0 | 1,021.2 | 7.3 |
| G | 6.7 | 4,642.0 | 39.7 | 12.0 | 2,355.1 | 19.3 |
| J | 7.7 | 2,903.6 | 22.3 | 21.9 | 1,067.3 | 8.2 |
| L | 6.3 | 4,492.8 | 31.7 | 21.9 | 1,057.7 | 13.6 |
| T | 6.2 | 3,972.1 | 27.0 | 12.8 | 1,589.4 | 8.1 |
| U | 7.0 | 2,868.8 | 21.6 | 18.0 | 911.3 | 7.3 |
| V | 8.7 | 2,944.0 | 18.9 | 23.4 | 846.8 | 5.4 |
When the concrete specimens were cleaved for additional measurements of the depth of penetration (Dp) per the Nordtest method (NT Build 492 1999), the results showed similar behaviors as the charge passage measurements. At 28 days, standard ashes increased depth of penetration by 17% compared to the control, while unconventional ashes decreased the depth of chloride penetration by 11% compared to the control. By 91-day age, when microstructure refinement had initiated, all concrete made with the investigated ashes generated substantially decreased depths of penetration compared to the control concrete. Statistical analyses (ANOVA at the 5% confidence level and Tukey-Kramer post hoc pairwise comparisons) on the depth of penetration measurements taken at 28 and 91 days showed no statistically significant differences between standard and unconventional ash sources at 28 and 91 days (p-values = 0.152 and 0.842). All investigated ashes also performed better than the control concrete in terms of chloride-ingress resistance. Thus, the RCPT results conclusively showed that on average these unconventional ashes exhibited comparable or greater durability performance against chloride penetration than standard ashes when used in concrete.
The strong correlations observed at 91 days between BR values and RCPT values for the concrete specimens are shown in Figure 43. Since both BR and RCPT are generally considered indicators of concrete durability, the correlations that occurred between them were anticipated. In principle, as pore refinement occurred causing an increase in BR, charge passage into the concrete was also reduced. This suggests that concrete performance in terms of durability can be assessed at later ages with either concrete BR or RCPT.
Sulfate Attack
The results for ASTM C1012 SA expansions for the control cement, investigated coal ashes, and inert filler materials at 30% cement replacement by mass are shown in Figure 44 and Table 33. In Figure 44, the 24-week expansion limits of 0.05% for high sulfate resistance and 0.10% for moderate sulfate resistance are indicated by the two horizontal dashed lines. Expansions should have been measured at 26 weeks to indicate 6 months, but were instead measured at 24 weeks, which
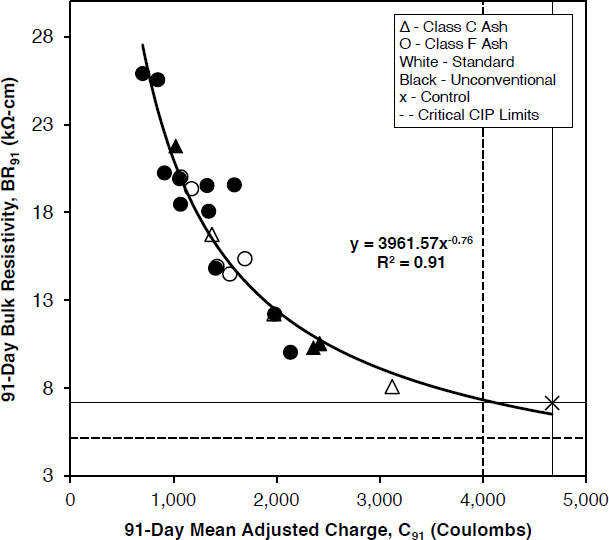

was an error in data collection. The sulfate resistance classifications that may have been affected by being close to the 0.05% limit at 24 weeks were A (0.043%), M (0.045%), and T (0.048%). At this age, it was observed that the control mortar bars generated an expansion of approximately 0.144%, indicating that it was not sulfate resistant. As anticipated, most of the Class C coal ashes—E, G, H, and K, with higher CaO contents (> 18%)—were either completely disintegrated by this age or had substantial expansion. Specifically, extremely high expansion observed in Class C unconventional ash G, which underwent complete disintegration by 4-week age, was attributed to its chemical and mineralogical compositions displaying a combination of extremely high CaO (25.5%), low sum of the oxides (37.8%), and high sulfate contents (17.4%) coupled with the presence of crystalline calcium- and sulfate-based phases such as gypsum (2%), bassanite (6%), and arcanite (1%). This ash would not be allowed under current or future AASHTO M 295 specifications for use in concrete. Similarly, for ashes E, H, and K, complete disintegration occurred prior to the 24-week mark (at 13, 16, and 8 weeks, respectively) and was attributed to a combination of high CaO contents (> 24%) and the presence of CaSO4 phases (2–3%). Poor resistance against sulfate expansion shown in these Class C ashes was also attributed to their higher crystalline tricalcium aluminate (C3A) contents, which, like high-C3A portland cement, are not sulfate-resistant (Tosun-Felekoğlu 2012).
As expected, Class F ashes as a group showed more resistance against SA than Class C ashes throughout the entire 72-week duration, yielding substantially lower expansions due to SA. Furthermore, all Class F ashes reduced SA expansion significantly compared to the filler materials. In terms of source, standard and unconventional ashes reduced 24-week SA expansions by 63% and 47%, respectively, compared to the control mortar. In terms of performance using the
Table 33. SA expansions at 6 and 12 months.
| Mixtures | 6-Month Expansion (%) | 12-Month Expansion (%) | Sulfate Resistance Classification Based on Expansion** |
|---|---|---|---|
| High sulfate resistance | 0.05 | 0.10 | - |
| Moderate sulfate resistance | 0.10 | - | - |
| Control | 0.144 | 0.309 | |
| A | 0.043 | 0.157 | MS |
| D* | 0.068 | 0.259 (warped) | |
| E* | Disintegrated | Disintegrated | |
| F | 0.032 | 0.121 | MS |
| H* | Disintegrated | Disintegrated | |
| I | 0.036 | 0.057 | HS |
| P | 0.039 | 0.045 | HS |
| Q | 0.105 | 0.181 | |
| B | 0.029 | 0.044 | HS |
| K* | Disintegrated | Disintegrated | |
| M | 0.045 | 0.096 | HS |
| N | 0.052 | 0.110 | MS |
| O | 0.094 | 0.159 | MS |
| R | 0.035 | 0.048 | HS |
| S | 0.079 | 0.118 | MS |
| C* | 0.275 | 0.733 | |
| G* | Disintegrated | Disintegrated | |
| J | 0.125 | 0.355 | |
| L | 0.056 | 0.132 | MS |
| T | 0.048 | 0.084 | HS |
| U | 0.040 | 0.089 | HS |
| V | 0.032 | 0.072 | HS |
* Class C (CaO > 18%)
** MS: moderate sulfate resistance; HS: high sulfate resistance
classification metrics of ASTM C1012, SA results indicated that at the current 30% cement replacement level, all the Class F ashes mitigated SA expansion more effectively than the control cement mixture, while Class C performed somewhat comparably to the control mixture. Specifically, depending on the chemical and mineralogical compositions, Class F ashes were able to mitigate 24-week SA expansion to a range of high sulfate resistance to moderate sulfate resistance. Conversely, most Class C ashes and the control mixture were highly susceptible to SA damage, failing to satisfy the maximum moderate sulfate resistance limit. Overall, all investigated Class F ashes, standard or unconventional, displayed more efficacy in mitigating SA expansion than the control cement mixture and may be viable for use in sulfate-exposed applications. However, Class C ashes, standard or unconventional, would not be recommended for use in concrete exposed to sulfate environments.
Concrete findings:
- Several unconventional coal ashes with high water demands and irregular/angular particle shapes decreased fresh concrete slump or workability and were mitigated by addition of a superplasticizer dosage in increments.
- By 28 and 180 days, many of the standard and unconventional ashes provided concrete strengths comparable to the control concrete. Several off-specification ashes (primarily low-fineness, with coarse particles) and standard ashes (both Class C and F) generated low concrete strengths.
- On average, concrete compressive strengths were higher in Class C than Class F ashes at all ages.
- Bulk and surface resistivity values of concrete specimens made with standard and unconventional ashes were significantly greater than the control concrete at 91 days and later, indicating reactivity. By 180 days, both standard and unconventional ashes generated comparable BR values on average.
- RCPT results did not identify significant differences in chloride ingress resistance between standard and unconventional coal ashes at 28 and 91 days. All ashes performed significantly better than the control in mitigating chloride ingress.
- Overall, most standard and unconventional ashes mitigated SA expansion more efficiently than the control and filler materials, with notable exceptions of high-CaO and high-SO3 ashes that would not normally be used for sulfate resistance.
Adsorption Results
Adsorption Behavior
This section presents results of the research intended to determine if unconventional or beneficiated ashes are significantly different from standard ashes with respect to adsorption of AEAs. Adsorption was assessed using LOI, FIT, iodine number, mortar air, foam drainage, and hardened concrete air void analysis. Work to understand methods and artifacts associated with adsorption testing is shown. Furthermore, differences between performance of major AEA types and effects associated with changes in mixing water solution chemistry, which could be caused by unconventional ashes, were evaluated.
In this test set, standard ashes are ashes A, D, E, H, and I. Unconventional ashes are ashes B, C, F, G, J, K, L, M, N, O, P, Q, R, S, T, U, and V. Ash U was a nonproduction sample acquired from a producer with the specific goal of evaluating the impacts of a very high-carbon, high-adsorption ash. This ash is currently beneficiated to reduce total LOI before sale and is not available for purchase in its unbeneficiated form. Two AEA sources were used in these tests: sodium lauryl sulfate (SLS) and vinsol resin (VR). More information on these AEAs is provided in Table 11.
LOI results for the ashes are shown in Figure 45. All ashes except the very high-LOI ash met the current AASHTO M 295 maximum limit of 5%. Three ashes (F, Q, and T) were very close to the limit. Of these ashes, two (F and Q) were standard ashes provided by producers as high-LOI ashes. T was a harvested and nonbeneficiated ash. Exceedance of the current limit does not seem to be common and will be even less common if the AASHTO M 295 limit is reconciled to the higher limit used by ASTM C618 (6%). LOI was very low in several of the samples (B, R, and S). Figure 46 compares the average and range in LOI for the standard ashes compared to the unconventional ashes. The mean LOI value was increased for the unconventional ashes (2.4%) compared to the standard ashes (0.6%) but is well within the limits currently allowed by both AASHTO M 295 (5%) and ASTM C618 (6%). With removal of the outlier sample, U, the LOI mean drops to 2.0% for unconventional ashes, which is still ∼1.5% higher than for the standard ashes tested in this research, but well within the acceptable range. The range of LOIs for the unconventional ashes in this test set is significantly wider than for the standard ashes, but still resulted in inner quartile ranges of ∼0.6%, which shows that 50% of the unconventional samples were within an LOI range of 1.4–2.6%. Additionally, standard deviation for the unconventional ashes, excluding ash U, was 1.6%. This suggests that for samples similar to those tested in this project, 95% of unconventional ashes will be within an LOI of 0.4–3.6%, and within the LOI limits of both the ASTM C618 and AASHTO M 295 specifications.


Primary LOI testing findings:
- The mean LOI value was increased for the unconventional ashes (2.0%) compared to the standard ashes (0.6%) but is within the limits currently allowed by both AASHTO M 295 (5%) and ASTM C618 (6%).
- The range of LOIs generated was significantly higher in the unconventional ashes than in the standard ashes. Considering the standard deviation for the unconventional ashes (excluding ash U), 95% of unconventional ashes were within a range of 0.4–3.6%, and within the LOI limits of both the ASTM C618 and AASHTO M 295 specifications.

Results of the foam index test conducted using the ASTM C1827-20 method and two different AEAs are shown in Figure 47, which shows the results as a percentage of the FIT of a portland cement slurry without coal ash. In this figure, a mixture having the same absolute volume of AEA as the portland cement control would generate a result of 100%. This value is referred to by ASTM C1827 as “relative absolute volume of AEA.” Evaluating coal ash adsorption relative to a control helps to limit variances in FIT values resulting from inherent variability in portland cement and in operator judgment of when the FIT endpoint occurs. Figure 48 shows the AEA dosage normalized relative

Figure 48. FIT test results for all ashes.

Figure 49. FIT results shown as the absolute volume of AEA required.
to the mass of cementitious materials (CM; cement + coal ash) in the mixture. Figure 49 shows the absolute volume of AEA required to reach the test endpoint. Although the ASTM C1827-20 method recommends reporting foam index results in either numbers of drops or absolute volume of AEA, the majority of results throughout this report are shown as normalized by the quantity of cementitious material (cement + coal ash) present in the mixture. A comparison of the results for the standard and unconventional ashes is shown in Figure 50.
The FIT of a 100% OPC mixture was obtained to provide a baseline for each admixture used. The OPC mixture FITs were 0.13 and 0.11 with standard deviations of 0.04 and 0.03 for the SLS and VR, respectively. Two classification levels (similar adsorption, higher adsorption) are recommended based on the results shown in Figure 48. The similar adsorption level (shown only for SLS) was

chosen as the values of the OPC sample FIT + 2 standard deviations, providing a 95% likelihood that a FIT < 0.21 (the low adsorption limit) is not significantly different from the OPC. This limit translates to an approximately 50% increase in adsorption, as is shown in the results normalized as a percentage of the control OPC slurry FIT (see Figure 47). Proposed limits are shown in Table 34. The similar adsorption limit is 0.21 mL/g of CM for the SLS AEA, and 0.17 for the VR AEA (not shown in the figure). “Higher adsorption” is adsorption exceeding the low limit. Note: this limit is suggested as an indication that a coal ash sample may have increased adsorption compared to the OPC (or PLC) sample, and increased AEA dosages may be required in concrete mixtures using this ash. This limit is not recommended to exclude coal ashes with higher FIT requirements but could be a point at which additional testing (mortar air or verification of ability to produce air-entrained concrete) could be required.
The bulk of all samples generated FIT values within the similar adsorption category and obtained similar FIT to that of the low-adsorption, low-LOI standard ashes (A, E, H, and I). One standard Class C ash (D) generated adsorption levels well above the similar adsorption range, illustrating that increased adsorption, as indicated by FIT value, is not a trait limited to unconventional ashes. Other ashes with higher adsorption include four ashes that also had higher-than-average LOI (F, LOI of 4.88%; Q, LOI of 4.6%; P, LOI of 3.83%; and U, LOI of 16.5% and reclaimed source); plus J, a cyclone collector ash; and Q and T, both harvested sources.
Off-specification chemistry did not appear to play a significant role in FIT adsorption in the ashes evaluated. For example, ash G with high sulfate content (17.4%) and ash H with low primary oxide content (SiO2 + Al2O3 + Fe2O3 = 50.1%) generated FIT levels well within the similar adsorption level with both AEAs. Ash M also generated a higher-than-average LOI but showed only low FIT adsorption.
Overall, the mean FIT values for both the standard and unconventional ashes (including the high-LOI ash U) were very similar (0.20 and 0.24 mL/g CM, respectively, for SLS and 0.15 and 0.18 mL/g coal ash, respectively, for VR), but were between 18% and 62% higher than the OPC mixtures for the SLS and VR, respectively. However, similar to the LOI results, unconventional ashes had an increased range of FIT values, even with the removal of the very-high-LOI ash, suggesting it is possible to obtain an ash source with a greater-than-typical level of adsorption when using an unconventional-source ash.
Iodine number testing results are shown in Figure 51. Results varied considerably from those of FIT and LOI testing, for reasons discussed in Appendix 5 (provided to AASHTO), which investigated possible artifacts associated with the iodine test. The iodine number test has been shown to provide a good indication of adsorption in previous reports (Sutter et al. 2013). However, results from samples with a wider variation in chemistry in this project suggest that this test does not accurately reflect AEA adsorption across the spectrum of chemical and physical properties expected with unconventional ashes, specifically with Class C and reclaimed high-LOI ashes. For example, the average iodine number was lower for the unconventional ashes than for the standard ashes (see Figure 52), a finding that was unsupported by all other testing in this study.
Mortar air testing results are shown in Figures 53–56. Mortar air testing was performed to provide an assessment of sample adsorption in an environment more similar to concrete. Additional
Table 34. Proposed limits for FIT based on control sample adsorption and variability.
| AEA | OPC FIT (mL/g CM) | Proposed Adsorption Limit: FIT | Proposed Adsorption Limit: Relative Absolute Volume (%) |
|---|---|---|---|
| SLS | 0.13 ± 0.04 | 0.21 | 150 |
| VR | 0.11 ± 0.03 | 0.17 | 150 |
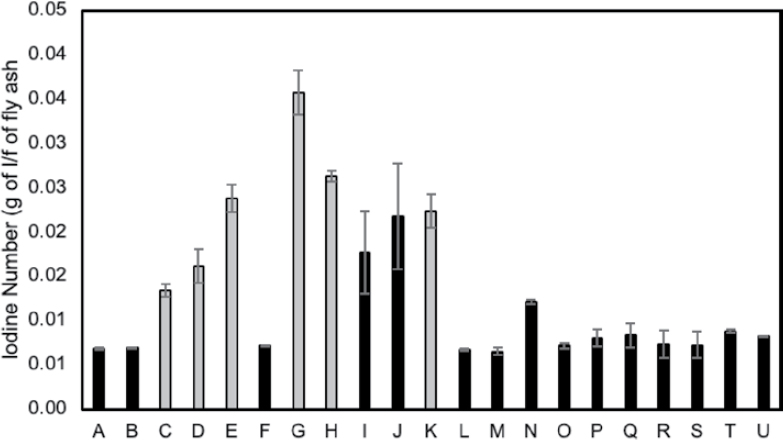
Figure 51. Iodine number values for study ashes.


mortar air results are in Appendix 5, which has been provided to AASHTO. All ashes generated shallower dosing curves than the OPC mixture, indicating that higher quantities of AEA were required to achieve a given air content for all ashes (see Figures 53 and 54). Ashes D, F, J, P, Q, T and U, which were also indicated by the FIT as having greater adsorption, had noticeably shallower dosing curves relative to all other ashes, suggesting they required greater AEA to achieve similar air contents. N, a blended ash, and V, a bottom ash blend, also had a less steep dosing curve, although

Figure 55. Mortar air AEA dosage required to obtain 18% air.

neither was indicated as having higher adsorption by the FIT test. Several unconventional ashes also became difficult to entrain with additional air over the 18% air content. This is indicated by several of the dosing curves leveling off above 18% air. This effect was significantly less noticeable in the standard ash and OPC mixtures.
Figure 55 shows the AEA dosage for each coal ash mortar required to achieve 18% air. Using a similar approach to the FIT test, a low adsorption limit was established as the dosage required by the OPC + two times the OPC sample standard deviation (2.86 µL/g CM + 2 × 1.20). From the unconventional sample set, ash L (high coarseness) and harvested ashes M, R, and S were within the low adsorption limit; 68% of the ashes (B, D, E, F, G, H, J, K, N, O, P, Q, T, U, and V) met or exceeded this limit, suggesting they required significantly greater AEA dosages to reach the 18% air threshold. Of these, D, F, and P are in-specification ashes; F, P, Q, T, and U have LOI values greater than 3.8; G has a high SO3 content; H is marginal for primary oxide content; J is a cyclone collector ash; and V is a bottom ash blend. Figure 56 suggests that the range of AEA demand generated by most unconventional coal ashes is similar to that of standard ashes. However, average mortar air AEA demand for the unconventional exceeded that of the standard ashes by 0.83 mL/g of CM and exceeded the OPC mixture AEA dosage by 4.88 mL/g CM. Most notably, the cyclone collector ash, J, required the greatest AEA dosage of all except the 16.5% LOI ash U.
Primary FIT and mortar air testing findings:
- Most of the unconventional ash samples generated FIT values not significantly different from an OPC control, nor different from most of the standard coal ashes.
- A FIT level equal to two standard deviations from the OPC FIT value was suggested as a limit for classification as a low-adsorption ash.
- Ashes exceeding that limit included F, Q, P, and U, which all had higher than average LOI; D and E (both standard Class C ashes); J (cyclone collector ash); P (standard Class F); and Q and T (both reclaimed coal ash sources).
- Unconventional ashes had increased range of FIT values compared to the standard ash set, suggesting that some unconventional ash sources will have a greater-than-typical level of adsorption.
- Mortar air testing confirmed higher adsorption in the sources indicated by FIT, but also found increased AEA requirements in ashes N (a blend of Class C and F ash) and V (a blend of Class C and bottom ash), which did not have higher adsorption indicated in the FIT results.
- J, the cyclone collector ash, showed very high mortar air test AEA demand despite low (3.1%) LOI.
Stability of Entrained Air
The air content of the mortar air mixtures was measured after a rest period to assess the stability of the bubbles formed in the mortars using each of the standard and unconventional ashes. Figure 57 shows the change in air content of the mortar air mixtures after a 1-hour rest period and 1 minute of remixing prior to transfer to the volumetric container used in the test. This approach is similar to approaches other authors have used to evaluate air void stability with mixing approaches attempting to mimic field transport mixer conditions (Y. Wang, Lu, et al. 2022, Khayat and Assaad 2002).
Instead of losing air over the rest period, 16 of the 22 ashes tested gained air, some by as much as 5%. It is possible that increased air was related to the 1 minute of remixing prior to testing. However, although results in Figure 58 suggest additional mixing will result in increased air content, most samples gained air in excess of that generated by 1 minute of additional mixing in the OPC sample (approximately 0.1% per minute). Gebler and Klieger (1983) showed correlation between coal ash specific gravity and air retention over time, with specific gravities less than 2.3 resulting in loss of more than 50% of the entrained air. Similarly, they showed links between coal ash sulfate content and air retention. Coal ashes with SO3 contents less than 3.5% resulted in > 20% loss in air, while ashes with SO3 > 50% resulted in increases in air content. However, no relationship between specific gravity nor sulfate content could be identified in this project’s set of ash samples, which included


more extreme variances in both properties. Thus, it is unclear why large increases in air occurred. Despite this, the ashes—except C (circulating fluidized bed ash), D (standard Class C ash), and T (a reclaimed ash)—showed no evidence of instability in retention of entrained air.
Results of the foam drainage test reinforce the conclusion that unconventional ashes are not increasingly prone to collapse of the air void system. Note that due to changing cement production in Ohio during the testing period, the foam drainage testing was conducted using PLC rather than OPC. Figure 59 shows changes in the volume of liquid that drained from the foam over the first 20 minutes of observation. Figures 60 and 61 show total volume of solution after the system rested for 60 minutes and the rate of change (slope) of liquid quantity during the first 5 minutes,

respectively. In the foam drainage test, greater liquid volume indicates reduced bubble stability as foam collapses and drains into the liquid portion of the sample. Following mixing, increases in overall liquid quantity (corresponding to decreases in foam) occurred in all samples between the end of agitation until minute 5. After 5 minutes, all samples’ drainage volume remained approximately consistent to the end of the 60-minute observation period.
Foam drainage test samples consisted of 300 mL of water and the dosage of AEA, so complete foam collapse would be indicated by liquid levels approaching 300 mL. Although no mixtures experienced complete collapse of the foam system, the ashes fell into three groups. One group performed better than OPC, with more stability and less overall reduction in foam between mixing and 60 minutes. This group comprised most of the ashes. One ash, G, performed similarly to OPC, losing slightly less foam height than OPC between minutes 3 and 6, and similar levels of foam dissipation as the OPC thereafter. The remaining ash, U, generated initially 2.6% less foam than the OPC mixture and increases in liquid volume 9.6% more than in the OPC mixture. Overall stability of the foam at 60 minutes varied very little across the sample set (see Figure 60).
X. Wang et al. (2019) proposed limits to determine the stability of the foam system formed based on the rate of change (slope, S5) during the first 5 minutes after mixing and the total drainage quantity (V60). They propose that stable foams would have both S5 < 100 and V60 < 200 mL and unstable foams would have either S5 > 150 or V60 > 350 mL. The performance of the ashes relative to these limits is shown in Figures 60 and 61. The V60 for all the ashes exceeded the limit for stable foams. Worst-performing were the OPC mixture, ash G (high-SO3 ash), and ash U (LOI = 16.5%).
Nearly all the ashes also met the criteria for “marginal” stability for the S5 criteria, apart from K (surfactant-modified ash), which was within the “stable” zone. But again, even the OPC mixture registered as marginal according to this scale, with only ash U exceeding the OPC value. As both the slope and volume criteria must be met to indicate a stable foam condition, all ashes and the OPC are considered to have marginal stability. However, all ashes except G and U exceeded the performance of the PLC in both metrics. Based on this, the combined results of the foam drainage test and 60-minute mortar air content testing suggest that unconventional ashes do not show increased likelihood of air void collapse or significant air dissipation after the concrete is placed compared to standard ashes and PLC mixtures.

Figure 60. Foam drainage test results showing volume of solution drained from a foamed sample at 60 min. after initial mixing.

Figure 61. Foam drainage test results the slope of the drained volume vs. square root of time curve during the time from mixing to 5 min.
Air content stability testing findings:
- Testing of mortar air contents after 1 hour of rest showed less than a 4% reduction in air content for all samples.
- Foam drainage testing showed that foams created in PLC-coal ash-AEA mixtures were generally more stable than PLC mixtures. Only the high-SO3 ash (G) and the 16.5% LOI ash (U) were less stable than the PLC.
- These results suggest that unconventional ashes are not more prone to collapse of the air void system.
Hardened Air Content and Spacing Factor
A sample of ashes was selected for concrete production and fresh and hardened paste air content testing. The concrete mixture design used is shown in Table 13 with the AEA dosages shown in Table 35. Except for A, which served as a control standard ash, the ashes were selected as the most likely to result in issues with air entrainment. Table 12 provides the hypothesized issues causing each of these ashes to be problematic from a concrete air entrainment perspective.
Volumetric air contents of 5–7% in fresh concrete were achieved with all mixtures (see Figure 62). This suggests that even for ashes with high adsorption, production of air-entrained concrete is possible through use of proper AEA dosing. Coal ash U did require significantly higher (+215%) AEA dosages than the average dosage required for all other ashes but achieved an air content of 8%. This dosage difference is even more apparent when normalized by air production in the mixtures. Overall AEA dosage differences in concrete for the other ashes indicated in mortar air testing and FIT as having higher AEA demand (G, J, Q, and T) were insignificant in concrete AEA dosage required to produce adequate entrained air levels.
Spacing factors calculated for the mixtures are shown in Figure 63. All mixtures achieved spacing factors well below the 0.2 mm maximum recommended by ACI 201 (ACI 201R-16) and the CSA
Table 35. AEA dosage in concrete.
| Coal Ash | AEA dosage | AEA Dosage per % Air (mL/g CM/% fresh concrete air) | FIT Relative Absolute Volume (%) | |
|---|---|---|---|---|
| mL/100 kg CM | mL/g coal ash | |||
| A | 260 | 8.65 | 0.361 | 113 |
| C | 198 | 6.62 | 0.354 | 109 |
| G | 238 | 7.95 | 0.345 | 118 |
| J | 208 | 6.95 | 0.401 | 321 |
| Q | 198 | 6.62 | 0.342 | 184 |
| T | 218 | 7.28 | 0.404 | 327 |
| U | 695 | 23.17 | 1.286 | 543 |
limit of 0.23 mm (CSA A23.1-14). Most of the mixture spacing factors were very similar and so display only a loose connection to bulk air content, although the trend is as expected—lower spacing factors correlate with higher bulk air contents (Figure 64). Additionally, bulk air content of 6% was sufficient to produce an adequate air matrix to protect from freezing and thawing damage in unconventional ash mixtures.
Overall, the use of unconventional ashes yielded very few concerns regarding air entrainment. Ashes J and U were consistently indicated as having the greatest AEA adsorption among the sample set, but overall differences in LOI, FIT values, and mortar air AEA requirements were not significant for most of the unconventional ashes. In addition, adequate air entrainment and void spacing factor were achieved in all the most potentially problematic ashes, suggesting that
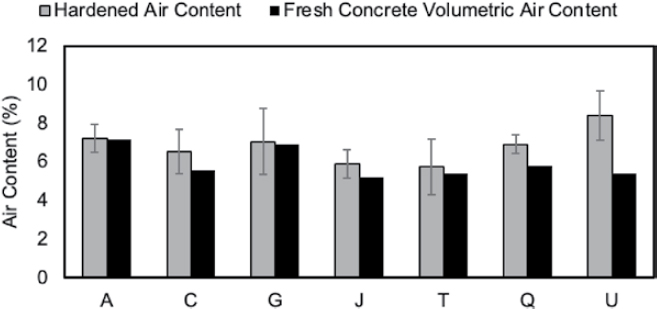
Figure 62. Hardened concrete and fresh concrete air contents.

Figure 63. Air void analysis spacing factor results.

any level of adsorption can be accounted for during the concrete mixture design process and so high-adsorption, or high-LOI, ashes should not be precluded from use based on LOI percentage or adsorption. For this reason, inclusion of the FIT value as a report-only value in the AASHTO M 295 specification is proposed.
Hardened concrete air testing findings:
- Adequate air content (volumetric air content of 5–8%) and spacing factor below the maximum suggested by ACI 201 were reached in all tested mixtures, including the extremely high-LOI coal ash mixture, suggesting that unconventional ashes can obtain satisfactory entrained air conditions and that high LOI does not prevent achievement of adequate air entrainment.
Adsorption Testing Methods
This section discusses testing and observations performed with each method evaluated during this study, with the goal of providing information to assess which method(s) can best provide the data needed to evaluate performance of new sources of coal ash.
Foam Index Test Method
At the start of this project, three methods of FIT were in use across the construction industry. These methods are largely similar but use varying mixture compositions: 2 g coal ash + 8 g OPC (20% coal ash); 5 g coal ash + 5 g OPC (50% coal ash); and 10 g coal ash (no cement, 100% coal ash). Testing was performed to compare the FIT results generated for each method (see Figure 65). Results are shown normalized both by grams of fly ash and grams of CM in order to evaluate each method’s ability to indicate changes occurring in the systems. Results were generally similar regardless of test method—ashes with low adsorption obtained low adsorption FIT values regardless of the mixture proportions. The most significant differences occurred in the high-adsorption samples, P and U. The procedure for calculating FIT did affect the values generated relative to coal ash proportion, while also illustrating the impact of solids on adsorption levels in the FIT.
To understand these results, it is important to understand the contributing factors to adsorption and removal of AEA from solution in cementitious and fly ash systems. Removal of AEA from

Figure 65. Comparison of FIT using the SLS AEA with varying proportions of coal ash.
solution occurs through several mechanisms: precipitation, or complexation between calcium dissolved in solution and AEA; chemisorption, or complexation between AEA and calcium or other ions present on the surfaces of particles; and physisorption, or attraction of the AEA to the surface of a particle as a result of charge imbalance and Van der Waals forces (Pedersen et al. 2008, Ahmed and Hand 2015, Ahmed et al. 2014a, Bruere 1955, Tunstall et al. 2017, Tunstall et al. 2021). True adsorption is only occurring in the chemisorption and physisorption interactions. Adsorption by carbon is primarily a physisorption interaction (Hill et al. 1997, Chen et al. 2003). However, all three of these mechanisms are occurring both in the concrete pore solution and the FIT solution, with significant interactions between dissolved calcium in solution, surface mineral calcium, and AEA. As a result, systems not taking into account precipitation reactions between AEA and ions in solution, or conversely only accounting for physical adsorption, may not provide a true indication of removal of AEA from solution that would occur in a concrete mixture. This effect is apparent when the two methods of normalizing the results (based on coal ash mass or based on total CM mass) are compared.
When the FIT results were normalized relative to the mass of coal ash used, the 20% coal ash samples generated the highest FIT in nearly all cases. This is likely an artifact of the normalization—when normalizing by coal ash mass, the 20% sample has a much smaller mass (2g) than the 50% and 100% samples (5g and 10g, respectively). However, normalizing by the mass of fly ash ignores the impacts of other materials present in the samples, such as the portland cement. In the FIT system, the cement will adsorb AEA through its physical surface area, as well as through chemisorption and precipitation of AEA with calcium dissolved from the cement. This normalization scheme creates an artificially increased FIT value for the system using the lowest quantity of coal ash because it ignores the removal of AEA from solution that results from the presence of the cement. When samples were normalized relative to CM (see Figure 66), FIT dosages increased with increasing coal ash quantities and thus high FIT was generated in samples with increasing quantities of adsorptive carbon.
In addition to the physisorption and chemisorption contributed by the presence of cement, cement may also affect FIT values generated. Tunstall et al. (2017) suggest that increased solution ionic concentrations can increase foaming potential of surfactants in solution, decreasing AEA requirements for mixtures using cement compared to those using only coal ash. Most samples normalized by total cementitious content resulted in similar results for the 20% coal ash and 50% coal

Figure 66. Comparison of FIT using the SLS AEA with varying proportions of coal ash.
ash mixtures, both of which used portland cement in the FIT mixture, and significantly increased AEA requirements for the 100% coal ash mixtures.
Finally, increased alkalinity of the solution, created during dissolution of cement and early precipitation of calcium hydroxide, can alter surface charge of the coal ash itself, changing how the ash interacts with AEA in solution (Figure 67). Samples tested without cement in the mixture may show different adsorption behavior than will occur in samples of cementitious mixtures. This may have occurred in samples D and P, which showed very high FIT in the 100% coal ash mixture, but low adsorption in the 20% and 50% mixtures.
Based on these results, one consideration is that when normalized to produce an AEA dosing value, the data should be normalized relative to mixture CM content, not relative to coal ash content, and the FIT should always be conducted using cement in the FIT slurry. Use of the 50% coal ash slurry mixture provides additional magnification of adsorptive properties of the coal ash and may provide better ability to differentiate between ashes with adsorption similar to or greater than portland cement mixtures.
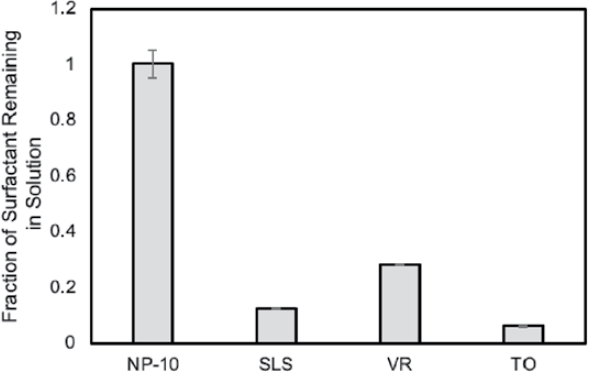
Figure 67. Fractions of surfactant in solution after incorporation of 15 mM Ca2+.

It was hoped that mortar air testing would be able to provide a more representative evaluation of coal ash adsorption and help identify well or poorly performing methods. Figure 68 shows the relationship between the AEA demand determined using the mortar air method and the foam index AEA dosage, as well as the relationship between LOI and mortar air results. Both FIT and LOI achieved good correlation with mortar air test results (R2 = 0.79). However, this relationship did not hold for LOI with removal of the high-LOI ash, suggesting the relationship was highly based on that single value (Figure 69). With removal of ash U, the slope of the trend line dropped by half and the correlation of LOI worsened significantly (R2 = 0.39). The primary ash outside the group for LOI was the circulating fluidized bed ash, J (shown at mortar air demand of ∼13 mL/g CM). The FIT-mortar air demand trendline’s fit also worsened with the removal of ash U, but less than LOI (to R2 = 0.51), and the correlation maintained its relationship much more closely, dropping by 13%. This suggests that although neither characterization method provides a perfect indication of changes in AEA adsorption, FIT provides superior differentiation, and a more consistent relationship exists between FIT results and air generation in mortar samples than LOI.
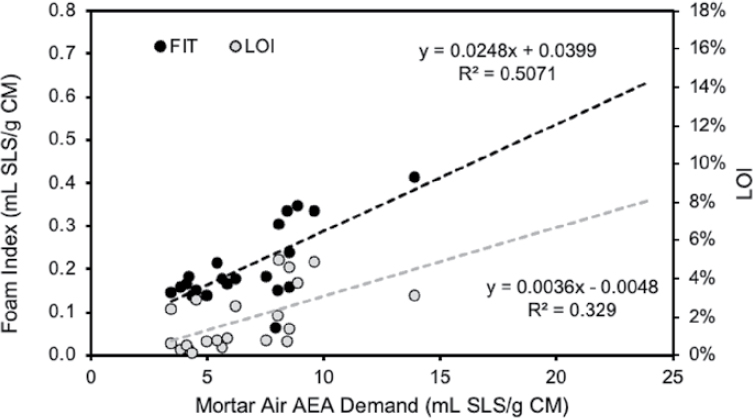
FIT Test findings:
- Normalization of FIT dosing results by coal ash content disregarded adsorption effects of other solids in the mixture. Normalization by CM content yielded changes in FIT results in line with expected observations based on changes in mixture composition and should be preferred over methods normalizing by coal ash content.
- FIT using a slurry of 50% coal ash and 50% portland cement provided better differentiation between varying adsorption levels.
- Use of a FIT without cement likely produces results inconsistent with adsorption effects of coal ash when used in a cementitious system.
- Better correlation was achieved between FIT and mortar air results than LOI and mortar air results.
Fluorescence Adsorption Measurement Method
A new method of measuring AEA adsorption on coal ash was developed for this project using a fluorescence spectrometer. A draft specification for this method has been provided to AASHTO as Appendix 4. An ideal adsorption test method would use a cementitious solution and the AEA planned for use in concrete mixtures. Previous iterations of the fluorescence method, Boral Resources’ SorbSensor, used an AEA-like surfactant molecule called Tergito NP-10 surfactant, from Spectrum chemicals, in a solution of coal ash only (no cement). Work was undertaken to update and create a method capable of using a commercially available fluorescence spectrometer and to enable determination of adsorption from a cementitious solution with coal ash.
Figure 70 shows the fluorescence signal generated using a variety of concentrations of the NP-10 solution. The fluorescence intensity generated with the NP-10 was found to correlate linearly with solution concentration (see Figure 71), suggesting that use of the NP-10 could allow for measurement of changes in solution concentration. Of the five sources of AEA used in this

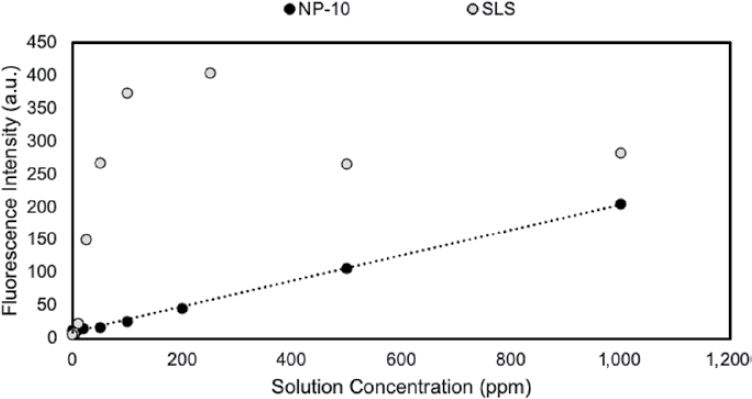
project (SLS, VR, WR1, WR2, and TO), only the SLS generated any fluorescence signal. The signal generated by the SLS is shown in Figure 72. However, varying solution concentrations resulted in production of a nonlinear fluorescence intensity (Figure 71), preventing direct use of SLS to accurately determine the concentration of the AEA solution. As a result, subsequent method development proceeded using the NP-10 molecule to mimic AEA-coal ash interactions.
Possible interactions between the NP-10 surfactant and calcium in solution were investigated using DI water solutions with 15 mM of dissolved calcium hydroxide [Ca(OH)2] into which AEA was mixed. All the AEA sources tested in this study underwent significant complexation with Ca2+, whether through precipitation and/or surface chemisorption, with as much as 90% of the AEA removed from solution after exposure to a high-calcium solution (see Figure 67). As a result, testing adsorption with ionic surfactants in an unsaturated calcium solution will yield different results

from use of an AEA in a saturated calcium solution, which the pore solution quickly becomes when cement is included in the mixture.
Unlike the AEAs—ionic surfactants—the nonionic NP-10 showed no evidence of interaction with calcium in solution, retaining 100% of its original concentration after exposure to a 15 mM Ca2+ solution. The NP-10 molecule did not precipitate with exposure to calcium, whereas as much as 90% of the other AEAs were removed from solution by the calcium solution. With no reaction between the NP-10 surfactant and calcium in solution, no information can be gained through the fluorescence method and using NP-10 with regard to AEA chemisorption or precipitation with dissolved calcium. However, avoiding calcium interactions also allows for quantification of physisorption adsorption processes, primarily dominated by varying unburnt carbon content, and prevents measurement discrepancies that could occur between coal ash samples with varying available calcium contents. This allows this test to meet the goals of assessing coal ash physisorption levels without using cement in the test slurry.
The effects of solid-to-liquid ratios on removal of NP-10 from solution were also evaluated. The fraction of NP-10 remaining in solution decreased approximately linearly with the quantity of coal ash used (see Figure 73). This observation is consistent with the lack of removal of the NP-10 molecule by calcium in solution and shows that the NP-10 can be used to track levels of physisorption associated with a coal ash sample. It also points to the ability of the fluorescence method and NP-10 molecule to be used without concern for specific sample solution solid-to-liquid ratios similar to those used in a concrete mixture.
Finally, the fluorescence method was tested across a set of five coal ash samples, with the NP-10 per gram of coal ash removed quantified. Results compared very closely with results of both the FIT and mortar air AEA dosages with both the SLS and VR AEAs (Figures 74 and 75), generating an R2 > 0.99 with FIT and > 0.94 for correlation with mortar air testing results. However, despite the correlation of results, FIT values exceeded those generated by the fluorescence method by two orders of magnitude (µL in the fluorescence method, mL in FIT), illustrating the need to understand the levels of precipitation and chemisorption that will occur between an AEA and calcium in pore solution to be able to use the derived AEA quantities in dosing for AEA in concrete mixtures. It is possible that a calibration coefficient could be created to translate fluorescence results to changes in required AEA dosage in concrete, but development of such a curve was not pursued here.


Fluorescence test findings:
- The bench-scale fluorescence method created here tracked adsorption of coal ash samples and generated very similar comparisons of adsorption among samples to those using the FIT method.
- A draft of a standard for this method has been provided to AASHTO as Appendix 4.
- The nonionic NP-10 molecule does not interact with dissolved calcium and so tracks physisorption effects only. Results closely correlate with FIT results, suggesting that the dominant component driving changes in coal ash FIT values relative to one another are differences in physisorption.
- Despite the correlation of results, FIT values exceeded those generated by the fluorescence method by three orders of magnitude (µL in the fluorescence method, mL in FIT), illustrating the need to understand the levels of precipitation and chemisorption that will occur between an AEA and calcium in pore solution to be able to use the derived AEA quantities in dosing for AEA in concrete mixtures. A calibration coefficient could translate fluorescence results to changes in required AEA dosage in concrete, but development of such a curve was not pursued here.
Varying Solution Chemistry and Its Impact on AEA Adsorption
One key to predicting variances in adsorption of new SCMs is understanding the impact of varying chemistry on admixture precipitation and adsorption. Work in this section attempts to answer the questions of what factors affect adsorption of air entrainers, and can differences in chemistry be used to predict what ashes may be problematic? Note that all the FIT tests performed to assess the effect of cations and anions in solution were performed without use of coal ash in the solution, and so they only track chemical interactions between dissolved ions and AEA. These effects do not account for changes in adsorption resulting from changes in charge of coal ash surface phases that result from changes in solution concentration and pH. This testing only provides understanding of changes in the dosages required to form a stable foam and levels of precipitation that will occur between AEA and ionic solutions.
Effect of Calcium in Solution
The interaction between dissolved calcium and AEA surfactants was assessed using several methods, including the fluorescence test, an FIT test without incorporated solid material, and measurement of ion concentrations in solution using inductively coupled plasma spectroscopy (ICP). Ca(OH)2 was dissolved in water at varying calcium concentrations and the amount of AEA remaining in solution, or the required dosage to reach FIT endpoint, was determined.
As illustrated in Figure 67, dissolved calcium in solution will complex with a significant proportion of each AEA, precipitating a calcium salt and removing a proportion of the AEA from solution. Complexation with dissolved calcium in solution or chemisorption with calcium minerals together resulted in removal of as much as 93.8% of the AEA from solution for the tall oil (TO) AEA solution, and 87.7% and 72.5% removed with use of the SLS and VR surfactants, respectively. The predominant portion of precipitated AEA no longer contributes to bubble generation. As a result, significantly increased dosages are required in FIT, mortar, or concrete mixtures to achieve adequate air entrainment.
The quantity of precipitated AEA is associated both with the particular AEA in use and with the concentration of calcium in solution. Figure 76 shows both these effects in mixtures of the VR and TO AEAs. These mixtures were tested without coal ash, only AEA + calcium dissolved in solution. Without any coal ash to influence the results, the TO required an order of magnitude greater dosage of AEA compared to in the VR system to form a stable foam. Similar results were shown by Tunstall et al. (2021) for VR and TO systems, with TO retaining lower residual AEA concentrations in solution following adsorption in a simulated pore solution. In addition, increased calcium concentration resulted in increased required AEA dosages to reach the FIT endpoint. This effect was increasingly pronounced with the TO AEA. Increasing ionic strength of the solutions
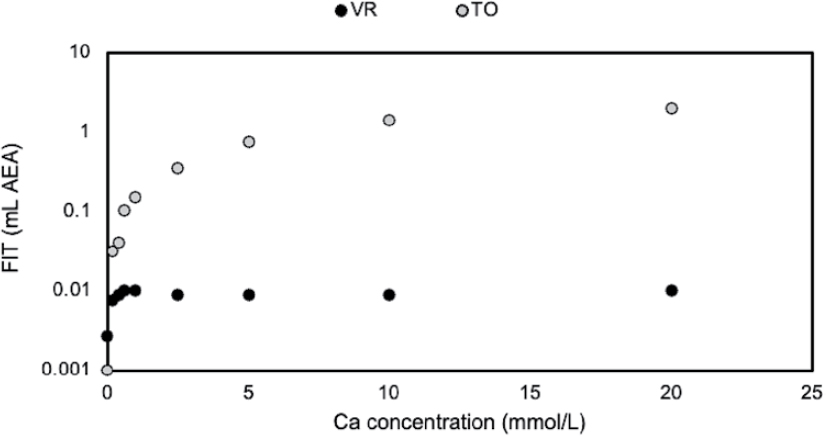
with increased calcium concentration would reduce system surface tension and thus reduce the AEA dosage required. As both systems showed significant increases in AEA dosage required with increasing calcium content, ionic strength seems to play less of a role in AEA dosage requirement than does calcium content.
Overall, higher calcium solutions will appear increasingly adsorptive when differences are tracked based only on AEA dosage requirements. Systems with higher calcium concentrations in solution will require greater dosages of AEA to overcome and ensure the formation of a stable foam to adequately entrain air in the system. However, this change in apparent adsorption is only a concern in systems not using cement as part of the mixture. Calcium reaches levels of saturation in cementitious systems within minutes (Brown et al. 1984) and will overcome any effects of varying dissolution rates and calcium availability in the coal ashes. In summary, although calcium changes the dosing requirements for AEA, this effect is not of concern in testing systems using cement (nor in the fluorescence method using a non-calcium-reactive molecule). Use of coal ash adsorption test methods that do not standardize or account for the interaction with calcium will underestimate the dosage of AEA required to obtain adequate air generation, and AEA could provide indications of differences in adsorption of coal ash sources that will not manifest in cementitious mixtures.
Effect of Cations and Anions in Solution and pH
To understand the impact of variances in cations and anions in solution that may result from use of unconventional coal ashes, solutions of 15 mM Ca(NO3)2 or Ca(OH)2 were dissolved in water to provide calcium concentrations similar to those during the early ages of cement hydration (Vollpracht et al. 2016). Use of these two compounds allows exploration of the impact of pH on AEA complexation with calcium—pH of the calcium nitrate solution was close to neutral, while the calcium hydroxide solution reached a pH of 12.4, similar to the pH of cement pore solution at early ages. Despite the variance in pH, the fraction of AEA remaining in solution in 15 mM Ca(NO3)2 solution showed only ∼2% difference from that of the 15 mM Ca(OH)2 solution, despite varying pH. This suggests that pH does not have a significant effect on Ca-AEA salt precipitation.
The effect of a variety of ions in solution and their changes in the proportion of AEA remaining in solution after exposure to a variety of solutions were assessed using the salts shown in Figure 77. A similar approach was used as with the assessment of the impact of calcium in solution, where mixtures were created using water, the salts shown in Figure 77, and AEA; no coal ash was included. Thus, the results shown primarily indicate changes in precipitants produced from

Figure 77. Changes in FIT AEA requirements in solutions with varying types of added cations and anions.
the salts in solution and AEA, and perhaps give some indication of the effects of ions on foaming action. These results do not account for changes in surface charge that could occur between coal ash and the ions in solution. All solutions used a saturated calcium hydroxide solution to maintain consistent pH (with the exception of the Ca(NO3)2 solution).
Solutions containing 0.5 mM of aluminum hydroxide and potassium silicate with 15 mM calcium hydroxide had little change on the quantity of AEA remaining in solution relative to a 15 mM calcium hydroxide solution. However, the addition of 0.5 mM potassium chloride, sodium chloride, and sodium sulfate to solutions of 15 mM calcium hydroxide all increased required AEA dosages by approximately 10%. The results of Tunstall et al. (2021) agree with this finding, showing increased ionic solution concentrations resulted in increased surface tension, which could lead to increased dosages of AEA required to obtain required surface tension reductions to enable AEA foaming.
FIT was used to further explore this phenomenon with regard to effects of cations on foaming potential of surfactants, with results shown in Figures 78 and 79. In this set of tests, a simulated pore solution was created using 150 mM KOH + 50 mM K2SO4 + 50 mM Na2SO4 + 2.5 mM Ca(OH)2 and the FIT AEA dosage required for other solutions was compared to the FIT required to create a stable foam with the simulated pore solution. Figure 78 shows the dominant calcium precipitation effect—a similar ionic pore solution without calcium resulted in a 99.7% decrease in VR AEA to reach the FIT endpoint. The effect, however, was not as pronounced, but still significantly decreased in the TO AEA, which required 68.6% less AEA. Use of DI water instead of the pore solution also decreased the AEA requirement for FIT for the VR AEA, resulting in an 88.8% decrease in AEA required for the VR solution. DI water increased the dosage of TO required to reach the FIT endpoint by 371.4%.
Solutions in Figure 79 attempted to further explore the influence of cations and solution concentration on AEA required to produce foam in the FIT test (without solids). In these solutions KOH was used to create high pH conditions (∼13.2) similar to cement pore solution. Relative to the original solution using 150 mM KOH + 50 mM K2SO4 + 50 mM Na2SO4, for the VR AEA, the presence of potassium sulfate resulted in increased AEA requirement (12.5–25% increases for

concentrations of K2SO4 ≥ 50 mM). Increased sodium concentration also resulted in an approximate 12.5% increase in AEA required. Some portion of this increased AEA requirement must be due to the presence of SO3, as a high concentration of potassium was also provided in a 340 mM KCl solution and did not result in any change in AEA required. With the TO AEA, all increases in potassium or sodium (using a chloride or a sulfate anion) resulted in decreases in AEA required to reach the FIT endpoint of 10–15%. However, increasing potassium concentration decreased the magnitude of AEA dosage requirement reduction (i.e., increasing potassium increased the AEA requirement).
Effects of varying composition and concentration relative to potassium chloride are shown in Figure 80, and relative to potassium sulfate in Figure 81. The FIT AEA requirements for TO AEA were increased with increasing concentrations of both Cl− and SO3−. Both compounds increased FIT AEA requirements at similar levels (approximately + 16%). Increasing potassium chloride concentration increased the VR requirement by a similar amount as it increased required TO AEA dosage, approximately 15%. The VR AEA was impacted much more significantly by increasing


potassium sulfate concentration, requiring on average a 35% increase in AEA as the concentration of potassium sulfate in solution increased from 0 to 100 mM.
In summary, calcium provides the most significant impact on AEA dosage requirements due to its proclivity for complexing with AEA, increasing AEA requirements by orders of magnitude. However, effects of varying calcium content in coal ashes are not anticipated to significantly change the AEA dosage required from a corresponding OPC mixture due to the much larger contribution of dissolved calcium to concrete pore solution from the cement dissolution. Sodium and potassium have less impact on AEA requirements, and their effect is AEA source-dependent, but increasing alkali content increased AEA requirements in all mixtures. Sulfate was also found to correlate with increased AEA requirements. Based on these results, the research team hypothesizes that concrete mixtures using high-alkali-content ashes and high-sulfate-content ashes (assuming the alkalis and sulfate are dissolvable during fresh state processes) could increase AEA requirements for air entrainment.

Impact of changes in ionic solutions on AEA findings:
- Calcium in solution precipitates a significant fraction of AEA. Adsorption test methods that do not standardize or account for the interaction with calcium will underestimate the dosage of AEA required to obtain adequate air generation, and AEA could provide indications of differences in adsorption of coal ash sources that will not manifest in cementitious mixtures.
- Addition of potassium, sodium, and sodium sulfate to AEA solutions resulted in small increases in required AEA dosages (by approximately 10%). Similar increases in AEA requirements from coal ashes with higher-than-typical water-soluble alkali and sulfate contents can be expected.
Changes in Adsorption Results with Transition to PLC
During this project, a transition occurred in cement production, limiting available cement to portland limestone cement. Figure 82 shows a comparison of FIT results with OPC compared to the PLC cement. In general, PLC mixtures required approximately 1/3 less AEA to achieve the FIT endpoint compared to in the OPC mixture. Significant reductions in AEA dosing have also been anecdotally reported from producers. Tagavifar et al. (2018), looking at adsorption of surfactants in petroleum applications, found adsorption by limestone to be low compared to other minerals like clays, and decreased with increasing pH > 9. This may suggest that the relative inertness of the added limestone contributes to reductions in AEA adsorption, despite the often finer size of the ground limestone. However, more work is needed to fully discern the causes of changes in PLC-AEA interactions. Due to the differences in required AEA dosage between OPC and PLC, the type of cement used in FIT should be reported with FIT results.
Influence of AEA Type
Differences in adsorption were assessed for a subset of the coal ashes using five sources of AEA (of four AEA types) in order to assess issues that might result from use of unconventional or off-specification coal ash sources and varying types of AEA. AEA types and their abbreviations are shown in Table 36.

Table 36. AEA types and their abbreviations.
| AEA | Admixture Type | Admixture details |
|---|---|---|
| SLS | Synthetic sodium lauryl sulfate | An anionic surfactant formed from reacting lauryl alcohol from a petroleum or plant source with sulfur trioxide to produce hydrogen lauryl sulfate, which is then neutralized with sodium carbonate to produce SLS |
| VR | Neutralized vinsol resin | A dark reddish-brown high-melting thermoplastic natural resin extracted from pinewood stumps and refined through a special process |
| WR1 | Wood rosin | A mixture of abietic acid derived from old pine strains |
| WR2 | Wood rosin | A mixture of abietic acid derived from old pine strains (different manufacturer from WR1) |
| TO | Tall oil | A mixture of organic salts in an aqueous solution |
In general, adsorption values varied similarly across all samples within an AEA source (see Figure 83). For example, ash K required the highest AEA FIT dosage requirement (except for high-LOI ash U) with every AEA. Similarly, with each coal ash the AEA dosages from least to greatest were found in the WR2 < VR < SLS < WR1 < TO. Further, the SLS, VR, and WR2 AEAs generated very similar FIT values for each of the coal ashes. WR1 and TO generally required significantly more AEA to reach the FIT endpoint.
Variances in required AEA dosage for different AEAs are likely related to the proportion of material in each AEA that will complex with calcium and form Ca-AEA salts. Testing showed the fraction of AEA removed from solution by complexation with calcium compounds varied by AEA, ranging from 60% to 80% of the initial sample concentration (Figure 67). Studies have indicated that the presence of ionic calcium not only removes calcium from solution, but also changes the nature of surfactant interaction with air voids (Qiao et al. 2020, Tunstall et al. 2017). Although Ca2+ complexation, which results in less AEA available for bubble formation, is likely a contributor to varying FIT between the AEAs, it does not account for all the variance. The SLS AEA, which generated very low FIT values, had similar Ca2+ complexation levels as the TO AEA, which generated FIT values sometimes an order of magnitude larger. Many other factors can contribute to air void creation and stabilization, including differences in the AEAs’ ability to reduce surface tension relative to calcium content as well as solution ionic strength (Ke et al. 2020, Tunstall et al. 2017, Huang et al. 2019).
Much less variability between the required AEA dosages occurred in mortar air testing with the five sources of AEA as shown in Figures 84 through 87. Very similar dosing requirements were


observed for all AEAs except TO. Although most of the ash mixtures came close (reaching air contents of 16–17%), meeting the 18% air requirement was very difficult using TO; 18% air was only achieved in one out of eight samples tested. All other AEAs had similar dosage requirements, typically ordered, from least to most: VR < SLS ≅ WR1 ≅ WR2 << TO.
Based on the significant differences in behavior during FIT and mortar air testing with the varying AEA types, it may be beneficial for an agency to choose a single standard AEA for testing and comparison of coal ashes. However, if this is not possible, use of SLS and VR admixtures generally resulted in very similar values.
Use of unconventional ashes with the five AEA types did not prove problematic. Furthermore, the testing did not indicate a major concern for the non-tall oil types of AEA tested, whether synthetic or natural in source, with regard to their ability to entrain air when used with unconventional coal ashes. Additional testing using concrete mixtures is needed before a major judgment against using tall oil AEA can be made. Previous research (Ley et al. 2009) found that the ability of an AEA to form an air void system capable of protecting concrete from freezing and thawing damage is not only related to foaming ability, but also the formation of a solid air void shell. Both tall oil and sulfate AEAs have been shown to be among the most effective in producing calcium air void shells due to their high interactivity with calcium in solution (Ley et al. 2009, Tunstall et al. 2017). This proclivity for shell formation may mitigate the inability of the AEA to achieve desired air contents in the mortar air testing.
Influence of cement and AEA type findings:
- Samples tested with PLC required on average 1/3 less AEA than samples tested with OPC.
- Changes in AEA dosage magnitudes varied consistently among the coal ash types for each AEA (coal ashes with higher adsorption using one type of AEA also required higher dosages with the other AEAs tested). Unconventional coal ash type did not significantly change FIT or mortar air results due to interactions between the AEA and coal ash.
- Different AEAs required different dosages to reach the FIT endpoint. If agencies wish to use the FIT to track magnitudes of or changes in adsorption they may need to require use of a standard AEA.
- Typically, dosing requirements from least to greatest were WR2 < VR < SLS < WR1 < TO.
- TO and WR2 required significantly higher dosages to reach FIT endpoints, but WR2 performed similarly to other AEAs in mortar air testing. TO was unable to generate the 18% air content required by the mortar air test with any of the investigated coal ashes.
- Due to differences in FIT when using different AEAs (and, theoretically, changes in AEA from batch to batch) and cements, a standardization procedure could be investigated. One approach may be to classify adsorption on the basis of % change from the dosage required to reach the FIT endpoint in a control (cement + AEA) mixture. This project’s limits given in the discussion of FIT and differences in adsorption across standard and unconventional ashes at the start of this section suggest that FIT dosages in coal ash + cement mixtures > 150% of the cement-only FIT mixture indicate significant increases in adsorption.
Assessment of Uniformity, Sampling, and Testing Frequency of Unconventional Coal Ash
Power Law to Evaluate the Effect of Sample Size and Testing Frequency Reduction
The power analysis results on the reduction in testing frequency from per 3,200 tons to per 6,400 tons on composite samples had varied effects on the measured ash properties. A reduction in sampling frequency indicates that the composite sample properties were hypothetically measured every 6,400 tons instead of every 3,200 tons. Reduction in sampling frequency typically caused the range of the difference of the mean for various parameters to increase (Table 37, Figures 88 and 89).
Table 37. Power analysis for difference of the mean (Δμ = δ) due to sample reduction from 3,200-tons (n = 40) to 6,400-tons (n = 20).
| Coal Ash | Sum of Oxides | CaO | SO3 | Moisture | Na2Oeq | LOI | Fineness | 7-d SAI | 28-d SAI | Water Requirement | Autoclave Expansion | Density | Foam Index |
|---|---|---|---|---|---|---|---|---|---|---|---|---|---|
| Sample size n = 40 (3,200-tons) | |||||||||||||
| W | 0.48 | 0.16 | 0.08 | 0.005 | 0.05 | 0.13 | 1.42 | 2.86 | 4.04 | 0.725 | 0.007 | 0.015 | ---- |
| X | 0.80 | 0.58 | 0.20 | 0.009 | 0.03 | 0.05 | 1.12 | 1.80 | ---- | 0.237 | 0.006 | 0.022 | ---- |
| Y | ---- | ---- | ---- | 1.131 | ---- | 0.93 | 1.15 | ---- | ---- | ---- | ---- | ---- | 0.80 |
| Yt* | ---- | ---- | ---- | ---- | ---- | ---- | ---- | ---- | ---- | ---- | ---- | ---- | 0.25 |
| Z | 0.20 | 0.21 | 0.02 | 0.059 | 0.26 | 0.21 | 0.74 | 1.57 | 1.89 | ---- | 0.004 | 0.014 | ---- |
| Reduced sample size n = 20 (6,400-tons) | |||||||||||||
| W | 0.68 | 0.23 | 0.11 | 0.008 | 0.08 | 0.18 | 2.01 | 4.05 | 5.71 | 1.03 | 0.010 | 0.021 | ---- |
| X | 1.13 | 0.82 | 0.28 | 0.012 | 0.05 | 0.07 | 1.69 | 2.54 | N/A | 0.336 | 0.008 | 0.031 | ---- |
| Y | ---- | ---- | ---- | 1.600 | ---- | 1.31 | 1.62 | ---- | ---- | ---- | ---- | ---- | 1.13 |
| Yt* | ---- | ---- | ---- | ---- | ---- | ---- | ---- | ---- | ---- | ---- | ---- | ---- | 0.35 |
| Z | 0.28 | 0.30 | 0.03 | 0.083 | 0.37 | 0.30 | 1.05 | 2.22 | 2.67 | ---- | 0.006 | 0.020 | ---- |
| % Diff due to sampling reduction | |||||||||||||
| W | 42% | 44% | 38% | 60% | 60% | 38% | 42% | 42% | 41% | 42% | 43% | 40% | ---- |
| X | 41% | 41% | 40% | 33% | 67% | 40% | 51% | 41% | ---- | 42% | 33% | 41% | ---- |
| Y | ---- | ---- | ---- | 41% | ---- | 41% | 41% | ---- | ---- | ---- | ---- | ---- | 41% |
| Yt* | ---- | ---- | ---- | ---- | ---- | ---- | ---- | ---- | ---- | ---- | ---- | ---- | 40% |
| Z | 40% | 43% | 50% | 41% | 42% | 43% | 42% | 41% | 41% | ---- | 50% | 43% | ---- |
Note: W and X are standard ashes
Y and Z are unconventional ashes
*Yt is coal ash Y treated to reduce air entrainment adsorption. Foam Index was also measured for Yt posttreatment

However, it did not indicate that a reduction in testing frequency had a significant effect on the mean, since most of the parameters still fell within their 95% confidence intervals and well within their respective specification limits.
Sampling frequency reduction—based on tonnage in this case—also appeared to affect the various parameters differently. For the standard ashes, fineness and Na2Oeq measurements were more susceptible to change due to a reduction in testing frequency from every 3,200 tons to every 6,400 tons. For unconventional ash Y, moisture content was the most susceptible to a reduction in the frequency of testing and sampling. For beneficiated comingled ash Z, autoclave expansion and SO3 content were most susceptible to reduction in sampling frequency from 3,200 tons to 6,400 tons. Overall, for both the tested standard and unconventional ashes, a reduction of testing frequency from every 3,200 tons to 6,400 tons would still allow for their acceptance by the specification limits.

This would imply that for the tested coal ashes, the current sampling and testing frequency for composite sampling is adequate for both types of ashes. However, not enough data were collected to determine if the daily or 400-ton sampling frequency on moisture content, LOI, or fineness is adequate for these coal ashes. It is likely that these parameters are more highly variable.
CSA T-Test to Evaluate the Effect of Testing Frequency Reduction on Passing Specification Limits
The t-test used by CSA A3004-A1 was used to verify the adequacy of the testing frequency reduction from per 3,200 tons to per 6,400 tons for composite samples in passing the specification limits of the various parameters. Specifically, the results in Table 38 show that a reduction in testing frequency for the tested coal ashes yielded negligible statistical changes and did not negatively affect the ability of each ash to pass the given specification limits with both a 99.5% and 95% confidence. This emphasizes that the current sampling and testing frequency on the composite samples is adequate for both the standard and unconventional coal ashes tested in this study. Again, not enough data were collected to determine if daily or 400-ton sampling on moisture content, LOI, or fineness limit testing is adequate for these coal ashes in comparison to specification limits.
Assessing Uniformity Parameters
In terms of the uniformity requirements prescribed in AASHTO M 295 (density, fineness, and optional AEA quantity to produce 18% mortar air content), all investigated standard and unconventional coal ashes generally fell well within the percentage limit from the moving mean using the 3,200-ton composite sampling rate (see Table 39). The uniformity limit specified by AASHTO M 295 mandates establishing the average of 10 preceding composite sample tests and comparing it to the next single measurement as a percentage difference. For unconventional coal ash Z, measured variations from the moving average for the density and fineness uniformity parameters fell within the 5% range, but a few testing points were above the 20% AEA spec limit from the moving mean (see Figure 90). For density measurements, the two standard ashes had a slightly lower moving average variation from the mean compared to the one unconventional ash (Z). However, the opposite trend was true for fineness.
Since adsorption is considered a significant property due to its influence on concrete air content (Obla 2014), the same moving mean procedure was computed for the FIT data of ashes X and Y pre- and posttreatment on 3,200-ton composite samples. The method of foam index measurement data that was provided by the supplier was nonstandardized and measured drops of AEA. For the treated ash (designated as coal ash Yt), the average foam index values decreased significantly compared to the untreated ash (coal ash Y) from 11.43 drops to 4.09 drops of AEA per test. Figure 92 shows the treated values also had less variation from the moving average than the untreated values, which is reinforced by results in Table 39. Compared to the standard ash (X), the average variation of the treated unconventional ash was much lower. Using a foam index measurement like this one as an optional uniformity assessment might be viable if a limit can be determined. This could be used to replace the more difficult uniformity test involving finding the quantity of AEA to produce 18% of mortar air currently specified in AASHTO M 295. However, more research is needed on this topic.
Regular sample data (daily or per 400 tons) were provided for fineness measurements for coal ash Y prior to treatment (designated as Yd in Table 39) and are compared to the simulated composite data as shown in Figure 91. The variance of the regular sampling (−9.6–22.8%) was much greater than the composite sampling (−4.4–5.6%) and outside the ±5% specified limit. Furthermore, regular sample data were also provided for foam index measurements before (Yd)
Table 38. Results of CSA t-test analysis for various uniformity parameters.
| Test | Current Standards | Plant Data | CSA Statistical Analysis | ||||||||
| Spec Limit (max) (ASTM C618/AASHTO M 295) | n | Frequency | Test Mean | Test Stdev | T-Stats Upper Bound | T-Value 99.5% CI | Freq (high limit)? | T-Value 95% CI | Freq (high limit)? | ||
| Standard Coal Ash W | Moisture content | 3 | 40 | per 3,200 tons | 0.06 | 0.01 | 306.16 | 2.708 | OK | 1.685 | OK |
| LOI | 5 | 40 | per 3,200 tons | 2.45 | 0.22 | 11.42 | 2.708 | OK | 1.685 | OK | |
| Fineness (retained 45 μm) | 34 | 40 | per 3,200 tons | 17.84 | 2.49 | 6.49 | 2.708 | OK | 1.685 | OK | |
| Na2Oeq** | 4.5 | 40 | per 3,200 tons | 2.44 | 0.09 | 22.02 | 2.708 | OK | 1.685 | OK | |
| Moisture content | 3 | 20 | per 6,400 tons | 0.05 | 0.01 | 356.80 | 2.861 | OK | 1.729 | OK | |
| LOI | 5 | 20 | per 6,400 tons | 2.50 | 0.22 | 11.30 | 2.861 | OK | 1.729 | OK | |
| Fineness (retained 45 μm) | 34 | 20 | per 6,400 tons | 18.60 | 2.69 | 5.73 | 2.861 | OK | 1.729 | OK | |
| Na2Oeq** | 4.5 | 20 | per 6,400 tons | 2.42 | 0.09 | 22.68 | 2.861 | OK | 1.729 | OK | |
| Standard Coal Ash X | Moisture content | 3 | 40 | per 3,200 tons | 0.07 | 0.02 | 194.40 | 2.708 | OK | 1.685 | OK |
| LOI | 5 | 40 | per 3,200 tons | 0.33 | 0.09 | 50.27 | 2.708 | OK | 1.685 | OK | |
| Fineness (retained 45 μm) | 34 | 40 | per 3,200 tons | 15.61 | 2.11 | 8.73 | 2.708 | OK | 1.685 | OK | |
| Na2Oeq** | 4.5 | 40 | per 3,200 tons | 2.19 | 0.06 | 37.69 | 2.708 | OK | 1.685 | OK | |
| Moisture content | 3 | 20 | per 6,400 tons | 0.05 | 0.01 | 356.80 | 2.861 | OK | 1.729 | OK | |
| LOI | 5 | 20 | per 6,400 tons | 0.32 | 0.08 | 61.25 | 2.861 | OK | 1.729 | OK | |
| Fineness (retained 45 μm) | 34 | 20 | per 6,400 tons | 15.00 | 1.85 | 10.28 | 2.861 | OK | 1.729 | OK | |
| Na2Oeq** | 4.5 | 20 | per 6,400 tons | 2.42 | 0.09 | 22.68 | 2.861 | OK | 1.729 | OK | |
| Unconventional Coal Ash Y | Moisture content | 3 | 40 | per 3,200 tons | 0.07 | 0.04 | 73.15 | 2.708 | OK | 1.685 | OK |
| LOI | 5 | 40 | per 3,200 tons | 1.06 | 0.37 | 10.70 | 2.708 | OK | 1.685 | OK | |
| Fineness (retained 45 μm) | 34 | 40 | per 3,200 tons | 15.04 | 2.01 | 9.42 | 2.708 | OK | 1.685 | OK | |
| Moisture content | 3 | 20 | per 6,400 tons | 0.07 | 0.03 | 115.82 | 2.861 | OK | 1.729 | OK | |
| LOI | 5 | 20 | per 6,400 tons | 1.05 | 0.14 | 28.43 | 2.861 | OK | 1.729 | OK | |
| Fineness (retained 45 μm) | 34 | 20 | per 6,400 tons | 15.25 | 1.90 | 9.85 | 2.861 | OK | 1.729 | OK | |
| Unconventional Coal Ash Z | Moisture content | 3 | 40 | per 3,200 tons | 0.34 | 0.10 | 25.60 | 2.708 | OK | 1.685 | OK |
| LOI | 5 | 40 | per 3,200 tons | 2.33 | 0.37 | 7.12 | 2.708 | OK | 1.685 | OK | |
| Fineness (retained 45 μm) | 34 | 40 | per 3,200 tons | 13.35 | 1.30 | 15.84 | 2.708 | OK | 1.685 | OK | |
| Na2Oeq** | 4.5 | 40 | per 3,200 tons | 2.42 | 0.46 | 4.54 | 2.708 | OK | 1.685 | OK | |
| Moisture content | 3 | 20 | per 6,400 tons | 0.38 | 0.09 | 30.61 | 2.861 | OK | 1.729 | OK | |
| LOI | 5 | 20 | per 6,400 tons | 2.50 | 0.22 | 11.30 | 2.861 | OK | 1.729 | OK | |
| Fineness (retained 45 μm) | 34 | 20 | per 6,400 tons | 13.23 | 1.27 | 16.32 | 2.861 | OK | 1.729 | OK | |
| Na2Oeq** | 4.5 | 20 | per 6,400 tons | 2.42 | 0.09 | 22.68 | 2.861 | OK | 1.729 | OK | |
** AASHTO R 80 limit (not AASHTO M 295/ASTM C618 limit).
Table 39. Uniformity properties of various ashes.
| Coal Ash | Density (g/cm3) | |||||
|---|---|---|---|---|---|---|
| Average value (g/cm3) | Min variation of moving mean (%) | Max variation of moving mean (%) | Average variation from moving mean (%) | Variation range of moving mean (%) | Uniformity range (%) | |
| W | 2.32 | –2.10 | 3.40 | 0.04 | –2.10 to 3.40 | +/–5% |
| X | 2.77 | –2.40 | 3.20 | 0.03 | –2.40 to 3.20 | +/–5% |
| Z | 2.32 | –3.80 | 3.10 | 0.09 | –3.80 to 3.10 | +/–5% |
| Coal Ash | Fineness (%) | |||||
| Average value (g/cm3) | Min variation of moving mean (%) | Max variation of moving mean (%) | Average variation from moving mean (%) | Variation range of moving mean (%) | Uniformity range (%) | |
| W | 17.84 | –4.98 | 4.21 | –0.79 | –4.98 to 4.21 | +/–5% |
| X | 15.61 | –6.40 | 3.80 | –0.47 | –6.40 to 3.80 | +/–5% |
| Y | 15.04 | –4.37 | 5.64 | –0.06 | –4.37 to 5.64 | +/–5% |
| Yd** | 14.32 | –9.63 | 22.82 | –0.02 | –9.63 to 22.82 | +/–5% |
| Z | 13.35 | –2.70 | 3.70 | –0.01 | –2.70 to 3.70 | +/–5% |
| Coal Ash | AEA (% to produce air content of 18.0 vol. %) | |||||
| Average value (%) | Min variation of moving mean (%) | Max variation of moving mean (%) | Average variation from moving mean (%) | Variation range of moving mean (%) | Uniformity range (%) | |
| Z | 0.71 | –19.70 | 21.10 | 4.02 | –19.70 to 21.10 | +/–20% |
| Coal Ash | Foam Index (mL/g or number of drops) | |||||
| Average value (no. of drops) | Min variation of moving mean (%) | Max variation of moving mean (%) | Average variation from moving mean (%) | Variation range of moving mean (%) | Uniformity range (%) | |
| X | 2.93 | –35.50 | 61.30 | 7.28 | –35.50 to 61.30 | Not established |
| Y | 11.34 | –19.47 | 50.16 | 2.33 | –19.47 to 50.16 | Not established |
| Yd** | 11.10 | –66.29 | 137.50 | 0.31 | –66.29 to 137.50 | Not established |
| Yt * | 4.09 | –25.07 | 31.83 | –0.98 | –25.07 to 31.83 | Not established |
| Ydt** | 4.03 | –51.22 | 81.82 | 0.25 | –51.22 to 81.82 | Not established |
Note: W and X are standard ashes
Y and Z are unconventional ashes
*Yt is fly ash Y treated with RestoreAir to lower its LOI. Foam Index was also measured for Yt posttreatment.
**Yd is daily measurements of fineness and Foam Index for Y. Ydt is daily measurement of treated Foam Index for Yt.
and after treatment (designated as Ydt in Table 39). As shown in Table 39 and Figure 91, the regular samples have much greater variability compared to the simulated composite samples for coal ash Y both before and after treatment. This indicates that using composite sampling for uniformity assessment is missing the true variability of these coal ash properties. However, it’s unclear from these data if this higher load-to-load variability would significantly impact the consistent use of the coal ash in concrete.
It should be noted that actual composite sample data for coal ash Y was not provided, and these composite data are simulated from the regular data by averaging. Therefore, caution should be taken in interpreting the results drawn here. However, it is likely that the composite samples would have lower variation between measurements compared to the regular samples for the same coal ash.
Levene Test for Equality of Variances of Standard and Unconventional Ashes
In testing for equality of the variances between standard and unconventional ash sources, various properties (moisture content, fineness, density, and foam index) were analyzed with the Levene test. For the most part, homogeneity in the properties between standard and unconventional ashes was not met, indicating they have different variances (see Table 40). Using the Levene test, the


Table 40. Levene test results of variance homogeneity for various uniformity properties of standard vs. unconventional ashes.
| Coal Ash Pair | Moisture content | |||
|---|---|---|---|---|
| F-value | p-value | % Diff in Variance*** | Conclusion | |
| Y - W | 21 | 1.63E-05 | 1,622% | Requirement of homogeneity is not met |
| Y - X | 13 | 4.40E-04 | 602% | Requirement of homogeneity is not met |
| Z - W | 93 | 5.89E-15 | 11,600% | Requirement of homogeneity is not met |
| Z - X | 83 | 6.39E-14 | -98% | Requirement of homogeneity is not met |
| Coal Ash Pair | Fineness | |||
| F-value | p-value | % Diff in Variance | Conclusion | |
| Y - W | 4 | 0.06 | -35% | Homogeneous |
| Y - X | 0 | 0.70 | -9% | Homogeneous |
| Z - W | 20 | 0.00 | -73% | Requirement of homogeneity is not met |
| Z - X | 7 | 0.01 | -62% | Requirement of homogeneity is not met |
| Coal Ash Pair | Density | |||
| F-value | p-value | % Diff in Variance | Conclusion | |
| Z - W | 0 | 0.84 | -7% | Homogeneous |
| Z - X | 11 | 0.00 | -58% | Requirement of homogeneity is not met |
| Coal Ash Pair | Foam Index | |||
| F-value | p-value | % Diff in Variance | Conclusion | |
| Y - Yt* | 11 | 1.23E-3 | 90% | Requirement of homogeneity is not met |
| Yd - Ydt** | 209 | 1.25E-42 | 93% | Requirement of homogeneity is not met |
| Y - X | 6 | 0.02 | 312% | Requirement of homogeneity is not met |
| Yt* - X | 2 | 0.13 | -60% | Homogeneous |
Note: W and X are standard ashes
Y and Z are unconventional ashes
*Yt is fly ash Y treated to reduce air entrainment adsorption. Foam index was also measured for Yt posttreatment.
**Yd is daily measurement of Foam Index for Y. Ydt is daily measurement of treated Foam Index for Yt.
***% difference comparison. For example, Y - W is the % difference of Y with respect to W.
F-value is the Levene statistic used to find the p-value. The p-value indicates whether the null hypothesis that the variance between two coal ash properties is equal is true. If p < 0.005 for that property, the variances are not equal.
The unconventional ashes tested here had lower variance for 3,200-ton composite sampling when tested on fineness and density compared to the investigated standard ashes. Furthermore, unconventional ash Z had lower variance in moisture content compared to one standard ash (X). But much higher variance in moisture content was detected when comparing unconventional ash Z to standard ash W, and unconventional ash Y to both standard ashes.
As anticipated, untreated ash Y had much higher variance in foam index compared to its treated counterpart Yt and standard ash X. However, the treated ash (Yt) had a lower variance compared to the standard ash (X), illustrating that beneficiation can effectively decrease the variance of pertinent coal ash properties, bringing standard and unconventional ashes to comparable levels of uniformity using composite sampling. When regular (daily/per-400-ton) sampling of the foam index of coal ash Y, designated Yd, was compared to its regular treated counterpart Ydt, the difference in the variance using regular sampling was comparable to the difference in the variance using composite sampling, but this could be an artifact of the method used to create the simulated composite sample.
Caution should be taken when using the Levene test since the test itself is less sensitive to departures from normality, which may be present in various properties of unconventional ashes, especially those obtained from unknown sources. However, the Levene test does provide the basis for comparing the variance of various physical and chemical properties between ash sources and may enable suppliers to check for variance between uniformity properties. The Levene test can also be used to compare the variance of a particular property of ash pre- and postbeneficiation.
Uniformity findings:
- The results of the power analysis and t-test on composite sampling (per 3,200 tons) conducted on two standard and two unconventional ashes indicated that reducing testing frequency from every 3,200 tons to every 6,400 tons did not negatively affect the ability of testing to catch outlier data nor fail to assess properties with respect to given limits. However, more data are needed to assess how regular sampling for moisture content, LOI, and fineness is affected by unconventional source ashes.
- When comparing the uniformity of the moving mean for the composite samples and subsequently using the Levene test to compare variances, the unconventional ashes had comparable or lower variance in fineness and density to the standard ashes, but much higher variance in moisture content (except in one instance). When comparing foam index uniformity, the untreated unconventional coal ash Y had much higher variance than the same coal ash after treatment and another standard ash. The beneficiation significantly improved uniformity variance for foam index measurements.
- Additional uniformity testing on regular sampling data—daily or per 400 tons—for an unconventional ash showed it had much higher variability in fineness and foam index measurements compared to composite sampling. This suggests that load-to-load variability may not be captured by current uniformity testing, which is performed on composite sampling. More regular sample data are needed to further investigate load-to-load variability.


