Real Estate
Are We Still in a Sellers Market?
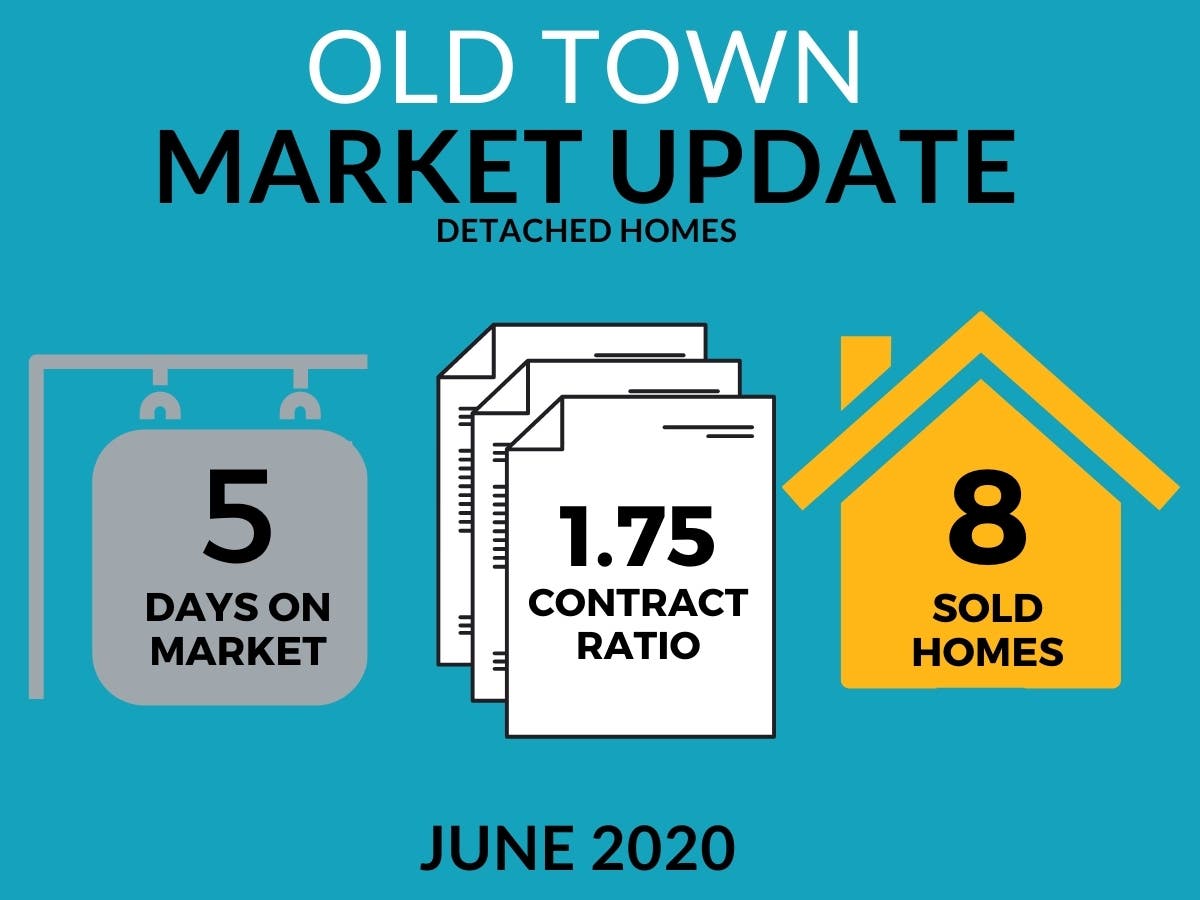
Check out how fast Old Town Alexandria properties are going under contract!
Although the market is super hot right now, many homeowners are wondering how we will know if the market is shifting from a seller's market to a buyer's market. A higher Contract Ratio signifies a relative increase in contract activity compared to supply, and indicates the market is moving in the seller's favor. A lower Contract Ratio signifies a relative decrease in contract activity compared to supply, and indicates the market is moving in the buyer's favor. In this article, we breakdown the trends in the Contract Ratio for detached homes, townhouses, and condos to see what's happening in the Old Town Alexandria real estate market.
OLD TOWN ALEXANDRIA DETACHED ACTIVITY:
In 22314, the median sold price for detached properties for June was $2,250,000, representing an increase of 111.8% compared to last month and an increase of 145.9% from June 2019. The average days on market for units sold in June was 5 days, 82% below the 5-year June average of 27 days. There was a 125% month over month increase in new contract activity with 9 New Pendings; a 133.3% MoM increase in All Pendings (new contracts + contracts carried over from May) to 14; and a 27.3% decrease in supply to 8 active units. This activity resulted in a Contract Ratio of 1.75 pendings per active listing, up from 0.55 in May and an increase from 0.65 in June 2019. The Contract Ratio is 124% higher than the 5-year June average of 0.78. This indicates the market continuing to favor sellers.
Table 1: Contract Ratio for Detached Homes in Old Town Alexandria
| Month | CLOSED | SOLD PRICE (MED) | DOM (AVE) | CONTRACT RATIO |
| JUN-20 | 8 | $1,250,000 | 5 | 1.75 |
| MAY-20 | 11 | $1,062,500 | 39 | 0.55 |
| APR-20 | 12 | $856,500 | 40 | 0.67 |
| MAR-20 | 13 | $842,500 | 42 | 0.69 |
| FEB-20 | 11 | $1,418,493 | 13 | 1.18 |
| JAN-20 | 14 | $897,500 | 51 | 0.43 |
| DEC-19 | 17 | $883,000 | 12 | 0.29 |
| NOV-19 | 18 | 0 | 0.28 | |
| OCT-19 | 20 | $900,000 | 41 | 0.20 |
| SEP-19 | 18 | $1,035,000 | 52 | 0.56 |
| AUG-19 | 11 | $915,000 | 18 | 0.56 |
| JUL-19 | 18 | $774,450 | 7 | 0.56 |
Find out what's happening in Old Town Alexandriawith free, real-time updates from Patch.
OLD TOWN ALEXANDRIA TOWNHOUSE ACTIVITY:
In 22314, the median sold price for townhouse properties for June was $802,500, representing a decrease of 3.3% compared to last month and a decrease of 10.3% from June 2019. The average days on market for units sold in June was 9 days, 56% below the 5-year June average of 21 days. There was a 43.3% month over month increase in new contract activity with 43 New Pendings; a 39.5% MoM increase in All Pendings (new contracts + contracts carried over from May) to 53; and a 48.3% increase in supply to 43 active units. This activity resulted in a Contract Ratio of 1.23 pendings per active listing, down from 1.31 in May and an increase from 0.90 in June 2019. The Contract Ratio is 58% higher than the 5-year June average of 0.78. This indicates the market beggining to favor buyers.
Table 2: Contract Ratio for Townhomes in Old Town Alexandria
| Month | CLOSED | SOLD PRICE (MED) | DOM (AVE) | CONTRACT RATIO |
| June | 43 | $802,500 | 9 | 1.23 |
| May | 29 | $830,000 | 20 | 1.31 |
| April | 32 | $935,000 | 22 | 0.91 |
| March | 34 | $937,950 | 23 | 1.18 |
| February | 33 | $874,500 | 25 | 0.88 |
| January | 26 | $780,000 | 36 | 1.19 |
| December | 24 | $838,000 | 21 | 1.00 |
| November | 35 | $812,497 | 41 | 1.06 |
| October | 50 | $754,900 | 9 | 0.74 |
| September | 45 | $725,000 | 33 | 0.73 |
| August | 30 | $746,550 | 20 | 0.87 |
| July | 37 | $985,000 | 22 | 0.81 |

OLD TOWN ALEXANDRIA CONDO ACTIVITY:
In 22314, the median sold price for condo properties for June was $590,000, representing an increase of 42.3% compared to last month and an increase of 36.3% from June 2019. The average days on market for units sold in June was 17 days, 36% below the 5-year June average of 27 days. There was a 20% month over month increase in new contract activity with 42 New Pendings; a 16.3% MoM increase in All Pendings (new contracts + contracts carried over from May) to 50; and a 32.4% increase in supply to 49 active units. This activity resulted in a Contract Ratio of 1.02 pendings per active listing, down from 1.16 in May and an increase from 0.97 in June 2019. The Contract Ratio is 39% higher than the 5-year June average of 0.73. This indicates the market beggining to favor buyers.
Find out what's happening in Old Town Alexandriawith free, real-time updates from Patch.
Table 3: Contract Ratio for Condos in Old Town Alexandria
| Month | CLOSED | SOLD PRICE (MED) | DOM (AVE) | CONTRACT RATIO |
| June | 49 | $590,000 | 17 | 1.02 |
| May | 37 | $414,500 | 11 | 1.16 |
| April | 41 | $610,000 | 13 | 0.83 |
| March | 35 | $523,250 | 24 | 1.03 |
| February | 31 | $432,450 | 24 | 1.16 |
| January | 19 | $542,500 | 35 | 1.84 |
| December | 16 | $520,500 | 32 | 1.75 |
| November | 22 | $530,000 | 16 | 1.45 |
| October | 35 | $486,000 | 13 | 0.80 |
| September | 28 | $487,500 | 35 | 1.46 |
| August | 21 | $386,750 | 20 | 1.29 |
| July | 27 | $432,500 | 15 | 1.00 |
About Peggy Yee
Peggy Yee is a supervising broker at Frankly Realtors and is a local Top Producer. She has sold over $180 million in sales and was one of Northern Virginia Magazine's Top Realtors since 2015. She has been quoted in the Around Reston Magazine, Washington Post, Money Magazine, Consumer Reports, Zillow, Trulia and Realtor.com. Peggy is 100% committed to making your move the best experience possible! Don't just take our word...Click here to see what Peggy's past clients have to say about the experience working with her from Buyer and Seller Video Testimonials and you'll understand why she is one of the top real estate agents in Old Town Alexandria with dozens of 5 Star Zillow reviews. Click here for Zillow Reviews.
* Data Source: BrightMLS and SmartCharts. Information deemed reliable but not guaranteed.