As we continue to navigate these unprecedented times with social distancing and COVID-19 cases fluctuating up and down, the Northern Virginia real estate market feels largely unaffected. In this article we analyze the real estate data in the area to really understand what is happening.
For this analysis, we compared the real estate data each month in 2020 against its 5-Year Average for that month. This comparison will shed light on how the current market is performing compared against historic performance, while taking into account monthly and seasonal variations.
FAIRFAX COUNTY NEW LISTINGS:
In Fairfax County, the new year started out strong with new listings for detached homes in January and February being just slightly higher than the 5-Year Average for these corresponding months. As COVID-19 cases in the United States began to rise in March, the new listings started to taper off, dropping to 84% of the 5-Year average for March new listings. When the State of Virginia stay at home order was implemented in late March 2020, we can see that further impacted the April and May new listings, hovering just above 60% of the 5-Year average for April and May new listings.
Table 1: New Listings for Detached Homes in Fairfax County
| 2020 Month | 5-Year Month Average | % Change |
| January | 608 | 607 | 100% |
| February | 916 | 892 | 103% |
| March | 1178 | 1399 | 84% |
| April | 861 | 1392 | 62% |
| May | 871 | 1332 | 65% |
Click here to sign up for my free monthly real estate market update to stay current on the latest real estate market trends in your neighborhood.
FAIRFAX COUNTY NEW PENDINGS & CLOSED SALES:
New Pending Sales represent the number of homes that went under contract. Once again, a similar trend was observed, where the months of January and February starting off very strong with the number of homes going off the market higher then the 5-Year Average for those months. In March, it dropped to 87%, followed by a another big dip down to 71% in April, before rebounding slightly in May to about 79%. As closed sales lag the New Pendings by about 30 days, we do see the increase in Closed Sales for February and March, greater than the 5 Year Average, followed by a drop in April and May.
Table 2: New Pendings for Detached Homes in Fairfax County
| 2020 Month | 5-Year Month Average | % Change |
| January | 501 | 486 | 103% |
| February | 689 | 650 | 106% |
| March | 808 | 930 | 87% |
| April | 682 | 963 | 71% |
| May | 785 | 991 | 79% |
Table 3: Closed Sales for Detached Homes in Fairfax County
| 2020 Month | 5-Year Month Average | % Change |
| January | 365 | 372 | 98% |
| February | 425 | 388 | 110% |
| March | 687 | 607 | 113% |
| April | 664 | 747 | 89% |
| May | 665 | 878 | 76% |
FAIRFAX COUNTY ACTIVE LISTINGS:
Active Listings represent the available homes on the market. Historically, the summer months of June and July represent the peak availability of homes on the market. The 5-Year Average of active listings for detached homes in June is 2149, which is almost double the 5-Year Average for January. With COVID-19, however, we are not seeing the normal supply of new homes coming on the market (See Table 1), resulting in the 982 Active Listings in May 2020 representing only half of the typical housing supply of detached homes. Analyzing the active listings for the past decade, there was only 7 individual months, where the number of active listings for detached homes dipped below 1000, and since December 2019 to now, we have encountered 4 of these months. The bottom line is that the supply of detached homes in Fairfax County is at historic lows.
Table 4: Active Listings for Detached Homes in Fairfax County
| 2020 Month | 5-Year Month Average | % Change |
| January | 747 | 1088 | 69% |
| February | 888 | 1215 | 73% |
| March | 1017 | 1508 | 67% |
| April | 1024 | 1725 | 59% |
| May | 982 | 1825 | 54% |
FAIRFAX COUNTY MEDIAN SOLD PRICE & AVERAGE DAYS ON MARKET:
The notable low inventory of homes is supporting a very robust sellers market, maintaining strong home prices and low days on market. In 2020, the median sales price for detached homes peaked at 111% of the 5-Year Average. The median sales price in April and May is still above the 5-Year Average, but prices are trending down. When the June 2020 data becomes available, it will be very interesting to see if this market cooling trend continues or if the low inventory will continue driving prices up.
When we look at the average days on market, the data is clear that homes continue to fly off the market. Both April and May had average days on market of 18 days, which is about 7 days faster than the 5-Year averages. With the historic low inventory of homes and strong buyer demand, there would be no reason to believe this trend will dissipate anytime soon.
Table 5: Median Sold Price for Detached Homes in Fairfax County
| 2020 Month | 5-Year Month Average | % Change |
| January | $670,000 | $636,650 | 105% |
| February | $698,999 | $640,380 | 109% |
| March | $737,000 | $662,790 | 111% |
| April | $725,000 | $670,500 | 108% |
| May | $701,000 | $669,990 | 105% |
Table 6: Average Days on Market for Detached Homes in Fairfax County
| 2020 Month | 5-Year Month Average | % Change |
| January | 43 | 53 | 81% |
| February | 39 | 51 | 76% |
| March | 24 | 38 | 63% |
| April | 18 | 28 | 64% |
| May | 18 | 24 | 75% |

RESTON SINGLE FAMILY HOMES FOR SALE:
In Reston, we are seeing similar trends as compared to the Fairfax County-wide data. For new sales, there was an decrease in the number of homes for sale compared to the 5-year average pre-COVID. Currently, there aren’t as many sellers coming back into the market as we would have expected in a “normal” market. As a result, there haven’t been as many pending and closed sales in April or May, compared to the 5-year average.
Table 7: New Listings for Detached Homes in Reston
| 2020 Month | 5-Year Month Average | % Change |
| January | 16 | 18 | 89% |
| February | 26 | 31 | 84% |
| March | 35 | 47 | 74% |
| April | 32 | 50 | 64% |
| May | 34 | 50 | 68% |
Table 8: New Pendings for Detached Homes in Reston
| 2020 Month | 5-Year Month Average | % Change |
| January | 10 | 15 | 67% |
| February | 15 | 24 | 63% |
| March | 24 | 31 | 77% |
| April | 21 | 33 | 64% |
| May | 25 | 37 | 68% |
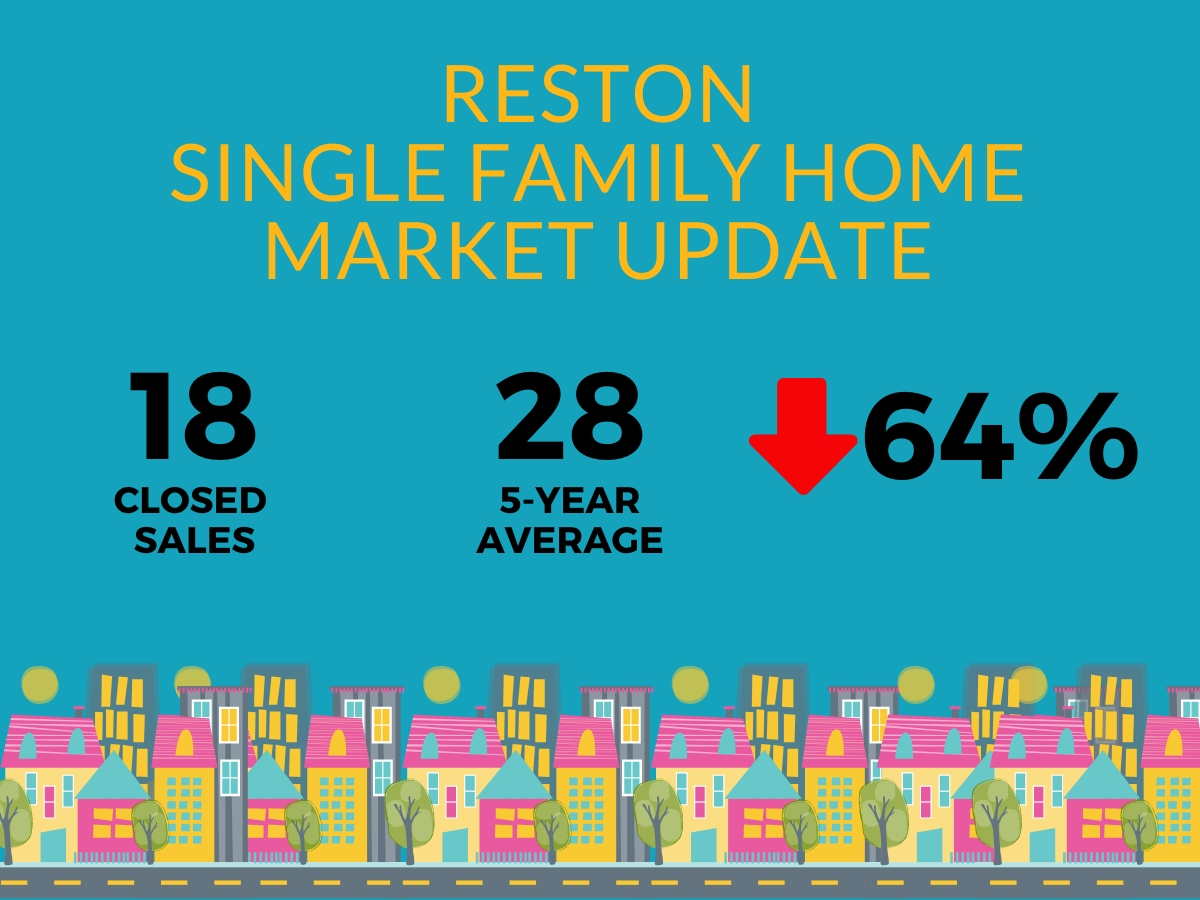
Table 9: Closed Sales for Detached Homes in Reston
| 2020 Month | 5-Year Month Average | % Change |
| January | 15 | 14 | 107% |
| February | 6 | 10 | 60% |
| March | 22 | 24 | 92% |
| April | 18 | 25 | 72% |
| May | 18 | 28 | 64% |
RESTON SINGLE FAMILY HOMES TRENDS:
The percentage of Active listings has also gone down in recent months. This, in combination with the fact that days on market are dropping, indicates that we are in a tighter seller’s market than before with more buyers coming back into the market than sellers.
Table 10: Active Listings for Detached Homes in Reston
| 2020 Month | 5-Year Month Average | % Change |
| January | 11 | 23 | 48% |
| February | 20 | 28 | 71% |
| March | 24 | 38 | 63% |
| April | 26 | 48 | 54% |
| May | 27 | 54 | 50% |
Table 11: Median Sold Price for Detached Homes in Reston
| 2020 Month | 5-Year Month Average | % Change |
| January | $700,000 | $658,400 | 106% |
| February | $706,999 | $659,945 | 107% |
| March | $757,500 | $707,770 | 107% |
| April | $798,000 | $710,600 | 112% |
| May | $712,500 | $710,555 | 100% |
Table 12: Average Days on Market for Detached Homes in Reston
| 2020 Month | 5-Year Month Average | % Change |
| January | 44 | 55 | 80% |
| February | 35 | 67 | 52% |
| March | 8 | 30 | 27% |
| April | 8 | 20 | 40% |
| May | 7 | 20 | 35% |
About Peggy Yee
Peggy Yee is a supervising broker at Frankly Realtors and is a local Top Producer. She has sold over $180 million in sales and was one of Northern Virginia Magazine's Top Realtors since 2015. She has been quoted in the Around Reston Magazine, Washington Post, Money Magazine, Consumer Reports, Zillow, Trulia and Realtor.com. Peggy is 100% committed to making your move the best experience possible! Don't just take our word...Click here to see what Peggy's past clients have to say about the experience working with her from Buyer and Seller Video Testimonials and you'll understand why she is one of the top real estate agents in Reston with dozens of 5 Star Zillow reviews. Click here for Zillow Reviews.
* Data Source: BrightMLS and SmartCharts. Information deemed reliable but not guaranteed.