Chapter 3 - Petroleum and Other Liquids Fuels
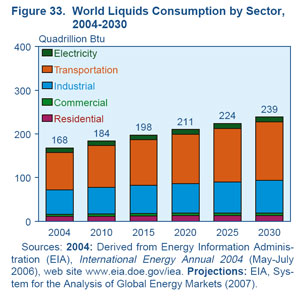
| World liquids consumption in the IEO2007 reference case increases from 83 million barrels per day in 2004 to 118 million barrels per day in 2030. Two-thirds of the increment is projected for use in the transportation sector. |
In the IEO2007 reference case, world consumption of
petroleum and other liquid fuels4 grows from 83 million
barrels oil equivalent per day in 2004 to 97 million in
2015 and 118 million in 2030. The demand for liquids
increases strongly in the projections, despite world oil
prices that remain above $49 per barrel5 throughout the
period. Much of the overall increase in liquids consumption is projected for the nations of non-OECD Asia,
where strong economic growth is expected.
To meet the increase in liquids consumption in the
IEO2007 reference case, liquids production is projected
to increase by 14 million barrels per day from 2004 to
2015 and by an additional 20 million barrels per day
from 2015 to 2030. OPEC producers6 are expected to provide more than one-half of the additional production in
2015 (8 million barrels per day) and more than two
thirds in 2030 (23 million barrels per day).
In the reference case projections, sustained high world
oil prices support a substantial increase in non-OPEC
liquids production. Non-OPEC production in 2030 is
projected to be 12 million barrels per day higher than in
2004, representing 35 percent of the increase in total
world production over the 2004 total. The estimates of
production increases are based on current proved
reserves and a country-by-country assessment of ultimately recoverable petroleum, as well as the potential
for unconventional liquids production.
The world oil prices in the IEO2007 reference case—and
in the high world oil price case—also are projected
to make previously uneconomical, unconventional
resources available. In 2004, world production of unconventional liquids totaled only 2.6 million barrels per day;
in 2030, in the reference case, unconventional liquids
production totals 10.5 million barrels per day (Figure 32)
and accounts for nearly 9 percent of total world liquids
production.
World Liquids Consumption
World liquids consumption in the IEO2007 reference
case increases to 118 million barrels per day (239 quadrillion Btu) in 2030, as the world continues to experience strong economic growth. Two-thirds of the increment in world liquids consumption in the reference
case is projected for use in the transportation sector,
where there are few competitive alternatives to petroleum (Figure 33). The industrial sector accounts for a
27-percent share of the projected increase, mostly for use in chemical and petrochemical processes.
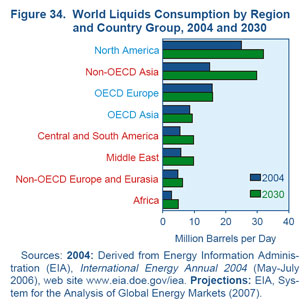
The largest increases in consumption between 2004 and
2030 are projected for North America and non-OECD
Asia, at 7 and 15 million barrels per day, respectively
(Figure 34). Outside North America, liquids consumption in the OECD regions generally grows more slowly,
reflecting expectations of slow growth or declines inpopulation and slow economic growth in most of the
OECD nations over the next two decades.
Strong expansion of liquids use is projected for the non
OECD countries, fueled by robust economic growth,
burgeoning industrial activity, and rapidly expanding
transportation use. The fastest growth in oil consumption is projected for the economies of non-OECD Asia,
averaging 2.7 percent per year from 2004 to 2030. For the other non-OECD regions, annual consumption growth
averages 1.0 percent in non-OECD Europe and Eurasia, 2.1 percent in the Middle East, 2.3 percent in Central and
South America, and 2.2 percent in Africa.
Non-OECD Asia accounts for 43 percent of the overall
increase in world liquids consumption, with projected
increases of 6.5 million barrels per day from 2004 to 2015
and another 8.5 million barrels per day from 2015 to
2030. China, India, and the other nations of non-OECD
Asia are expected to experience combined economic
growth of 5.8 percent per year from 2004 to 2030, the
highest rate among all the world regions. The robust
expansion of GDP projected for non-OECD Asia contributes to a 2.7-percent average annual increase in the
region’s liquids use.
World Oil Prices
The world oil price cases in this report are the same as
those in EIA’s Annual Energy Outlook 2007. In the reference case, world oil prices decline from $68 per barrel in 2006 to $49 per barrel in 2014, then rise to $59 per barrel in 2030 ($95 per barrel on a nominal basis). Total world
liquids consumption rises to 118 million barrels per day
in 2030 in the reference case. The low and high price
cases are included to illustrate uncertainties in the reference case projections (Figure 35). In the low price case,
world oil prices are projected to be $36 per barrel in 2030 ($58per barrel on a nominal basis). In the high price case, oil prices are projected to be $100 per barrel in 2030 ($157 per barrel on a nominal basis). The projections for total
liquids consumption in 2030 range from 103 million barrels per day in the high price case to 134 million barrels
per day in the low price case, indicating the substantial
range of uncertainty in the world’s future oil markets.
World Liquids Production
In the IEO2007 reference case, world liquids production
in 2030 exceeds the 2004 level by 35 million barrels per
day (Figure 36). Increases in production are expected for
both OPEC and non-OPEC producers; however, 65 percent of the total increase is expected to come from OPEC
areas. In 2030, OPEC is expected to produce 57 million
barrels per day and non-OPEC producers 61 million barrels per day in the reference case. Over the past two
decades, the growth in non-OPEC liquids production
has resulted in an OPEC market share substantially
below its high of 52 percent in 1973. In 2004, OPEC produced 41 percent of the world’s liquids supply. High oil
prices, new exploration and production technologies,
aggressive cost-reduction programs by industry, and
the emergence of unconventional resources contribute
to the outlook for continued growth in non-OPEC
liquids production.
The reference case outlook for liquids production was
formulated in a two-stage approach. The mid-term projections (through 2015) are based primarily on the current activities of the oil industry and national
governments, including: current production volumes;
recent rates of decline in output from producing fields;
planned exploration, development, and enhanced oil
recovery activities; country-specific policies and fiscal
regimes; and current conflicts and social unrest that
could interrupt production and make incremental
investments more risky. After 2015, the reference case
assumes that production decisions are made primarily
on economic grounds, based on assessments of the resource base, with less weight placed on current political conditions.
The IEO2007 reference case projects greater reliance on
OPEC oil supplies than was anticipated in last year’s
outlook. In IEO2006, OPEC’s total liquids production
(excluding Angola) was projected to increase by nearly
15 million barrels per day from 2003 to 2030; in IEO2007, the projected increase in OPEC production (excluding
Angola) is about 22 million barrels per day over the
same period. An extensive review of anticipated investment in exploration and production through 2015 was
conducted for IEO2007. As a result, the projections of
non-OPEC supply from several key producers were
lowered. However, the investment that several OPEC
members (notably, Saudi Arabia and Angola) currently
are making to expand their oil production capacity is
expected to more than offset the slower expansion of
non-OPEC supply projected in this year’s outlook.
There are several regions where production is restrained
through 2015 in the reference case. For instance, in the
key resource-rich countries of Mexico and Venezuela,
expected investment levels are lower than those
assumed in the IEO2006 reference case. In both countries, liquids production is projected not to expand (and,
in Mexico, to decline) until after 2015, when economic
decisions on investment allow production to improve.
Also, North Sea production is projected to decline more
rapidly than in last year’s outlook. The rate of decline in
North Sea production over recent years has been higher
than observed in earlier years, and economics do not
support a reversal of the declining trend in the IEO2007
reference case. In Iran and Iraq, political developments
are assumed to keep production levels fairly flat until
after 2015, when investment and production are projected to grow strongly through 2030.
IEO2007 includes supply estimates for the low and high
world oil price cases, based on the availability of world
crude oil resources. In the high price case, worldwide
crude oil resources are assumed to be 15 percent smaller
and therefore more expensive to produce than in the reference case, and the preferred production levels of
OPEC producers are reduced. In the low price case,
worldwide crude oil resources are assumed to be 15 percent larger and therefore less expensive therefore to produce than in the reference case, and the preferred
production levels of OPEC producers are increased. In
each of three oil price cases, a business-as-usual oil market environment is assumed. The IEO2007 cases do not
consider disruptions in oil production for any reason
(war, terrorist activity, weather, geopolitics).
Non-OPEC Production
The world oil prices projected in the IEO2007 reference
case allow non-OPEC suppliers to expand their production through 2030. Non-OPEC production increases
steadily in the projections, from 49 million barrels per
day in 2004 to 61 million barrels per day in 2030, as high prices attract investment in areas previously considered
uneconomical. The non-OPEC market share in 2030,
however, at 52 percent of the world’s liquids production, is lower than its 2004 share of 59 percent.
Non-OPEC conventional liquids production in the reference case increases from 47 million barrels per day in
2004 to 51 million barrels per day in 2015 and 53 million barrels per day in 2030, and unconventional liquids production from non-OPEC suppliers rises to 4 million barrels per day in 2015 and 8 million barrels per day in 2030. In the high world oil price case, non-OPEC unconventional liquids production rises to 11 million barrels per
day in 2030, as compared with 4 million barrels per day
in 2030 in the low price case, where most unconventional liquids are not economically competitive.
North Sea production is projected to decline more rapidly in the IEO2007 reference case than was projected in
IEO2006. Production from Norway, OECD Europe’s
largest producer, appears to have peaked at about 3.4
million barrels per day in 2001, and it is projected to continue declining to about 1.4 million barrels per day in
2030 as the larger and older fields mature. Production
from the United Kingdom, which peaked in 1999 at 3.0
million barrels per day, is projected to fall to 0.5 million
barrels per day in 2030.
Oil production in the non-OECD Europe and Eurasia
region is projected to reach nearly 15.0 million barrels
per day in 2015, based in large part on the potential
investment outlook for the Caspian Basin region, where
long-term production potential still is regarded with
considerable optimism. Caspian output more than doubles from the 2004 level to 4.3 million barrels per day in
2015 in the reference case and increases steadily thereafter. Current uncertainty about export routes from the
Caspian Basin region is assumed to be resolved.
North African producers Egypt and Tunisia produce
mainly from mature fields, and the IEO2007 reference
case assumes few additions to resources in the future. As a result, their production volumes decline gradually in
the projections. In East Africa, Sudan is expected to produce significant volumes by the end of this decade, with
the potential to exceed 700,000 barrels per day in 2010.
Eritrea, Somalia, and South Africa also have some
resource potential, but they are not expected to produce
significant volumes until late in the projections.
Several West African producers—Cameroon, Chad,
Congo (Brazzaville), Equatorial Guinea, Gabon, Mauritania, Niger, Sao Tome and Principe, and Ivory Coast—are expected to reap the benefits of substantial exploration activity, especially if current high oil prices persist.
West African producers with offshore tracts are expected to increase output by up to 1.1 million barrels
per day by the end of the projection period.
Oil producers in the Pacific Rim are expected to increase
their production volumes as a result of enhanced exploration and extraction technologies. India’s deepwater
prospects are expected to show some encouraging production increases in this decade, with the potential for
significant increases near the end of the projection
period. China’s conventional oil production is projected
to decline slightly, to about 3.3 million barrels per day in
2030.Vietnam’s long-term production potential is
viewed with considerable optimism, although exploration activity has been slower than originally anticipated.
Output from Vietnamese fields is projected to reach
504,000 barrels per day in 2015.
Malaysia is not expected to find significant new
reserves; its output has already peaked and is expected
to decline gradually through the end of the projection
period, to less than 500,000 barrels per day in 2030.
Papua New Guinea continues to add to its proved
reserves and is expected to achieve production volumes
approaching 110,000 barrels per day in 2015, followed
by only a modest decline over the remainder of the projection period. Exploration and test-well activity have
pointed to some production potential for Bangladesh
and Myanmar (formerly Burma), but significant output
is not expected until after 2010.
In North America, U.S. output that rises to 10.1 million
barrels per day in 2020 and remains fairly flat through
the end of the projection period is expected to be supplemented by significant production increases in Canada.
Canada’s conventional oil output contracts steadily in
the reference case, by about 0.5 million barrels per day
over the next 25 years, but an additional 2.5 million barrels per day of unconventional output from oil sands
projects more than offsets the decline in conventional
supplies. Since the publication of IEO2006, Mexico’s
state oil company, Petróleos Mexicanos (Pemex), has
announced annual production decline rates of 14 percent in its largest oil field at Cantarell [1]. The IEO2007
reference case does not anticipate adequate investments
through 2015, and as a result, production in Mexico is
projected to fall to 3.0 million barrels per day in 2015 (see
discussion on Reassessing the Potential for Oil Production in Mexico). IEO2007 assumes that declining revenue from oil production in Mexico ultimately will
encourage government action to increase investment
and technology access in the petroleum sector after 2015.
Given the country’s available resource base, such action
eventually should reverse the decline in production.
Liquids producers in South America have potential for
increasing output over the next decade. Brazil became a
million barrel per day producer of crude oil in 1999, with considerable production potential waiting to be tapped.
Brazil’s production rises throughout the projection period, to 3.9 million barrels per day of conventional
production and 0.5 million barrels per day of unconventional production in 2030. Colombia’s current economic
downturn and civil unrest have delayed development of
its oil production infrastructure, but its output is
expected to reach 700,000 barrels per day in 2015, with
continued modest increases over the remainder of the
projection period. Although the current political situation in Ecuador is in transition, there is still optimism
that Ecuador will increase production volumes over the
projection period.
OPEC Production
It is generally acknowledged that OPEC members with
large reserves and relatively low costs for expanding
production capacity can accommodate sizable increases
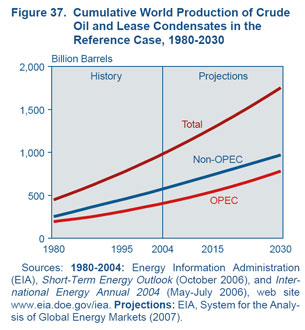
in the world’s petroleum consumption. In the IEO2007
reference case, the production call on OPEC suppliers
grows at an annual rate of 2.0 percent through 2030
(Figure 37).
Amidst enormous uncertainty, Iraq’s role in OPEC in
the next several years will be of particular interest. In
1999, Iraq expanded its production capacity to 2.8 million barrels per day in order to reach the maximum
export revenue (slightly more than $5.2 billion) allowed
under United Nations Security Council resolutions.
Iraq’s oil production capacity in 2007 is assumed to be
2.0 million barrels per day [2]. Iraq has indicated a desire
to expand production aggressively, to more than 6
million barrels per day, once the security and political
situation in the country has stabilized. Preliminary discussions of exploration projects have already been held
with a number of potential outside investors. In the
IEO2007 reference case, Iraq’s oil production is projected
to reach 3.3 million barrels per day in 2015 and 5.3 million barrels per day in 2030.
Oil production in Iran is projected to increase only
slightly in the early years of the reference case, from 4.1
million barrels per day in 2004 to 4.3 million barrels per
day in 2015, despite the country’s sizable resource base.
In the long run, Iran’s oil production is projected to
reach 5.0 million barrels per day in 2030.
Kuwait and the United Arab Emirates (UAE) are
expected to follow similar growth paths in their oil production sectors. In 2004, levels of production from the
two countries were 2.5 and 2.8 million barrels per day,
respectively; in 2015, they are projected to be 3.2 and 3.8 million barrels per day, respectively; and in 2030 they are projected to be 4.1 and 4.9 million barrels per day,
respectively. Qatar’s production is projected to grow
from 1.0 million barrels per day in 2004 to 2.9 million
barrels per day in 2030, with liquids other than crude oil
expected to provide more than half the increase.
In the past, Saudi Arabia—with its very low development and production costs per barrel of output—has
maintained 1 to 5 million barrels per day of spare production capacity, which has given it considerable market power. It is expected to maintain average spare
capacity of 1 to 2 million barrels per day in the future. In the reference case, Saudi Arabia’s production is projected to be 9.4 million barrels per day in 2015 and 16.4
million barrels per day in 2030.
Angola became a 1.1 million barrel per day producer in
2004,and the results of deepwater exploration indicate
that its production could increase to as much as 4.0 million barrels per day by 2030. The rapid increase in
Angola’s production demonstrates the importance of
political stability, international investment, and technology advances. Angola’s oil production languished for
the most part during a 20-year civil war, which ended in
2003. It was not until the late 1990s, when prospects for a
peaceful resolution were taking shape, that the foreign
investment needed to support offshore production
began to materialize. Angola’s decision to join OPEC in
January 2007 is not expected to slow the increase in its oil
production, given that other OPEC members were
granted some flexibility while they were rapidly
expanding their production.
In the IEO2007 reference case, OPEC members outside
the Persian Gulf (excluding Angola) are projected to
increase their production capacity only moderately, in
part because of the relatively high cost of capacity
expansion in most of the member countries. There is
some optimism surrounding Nigeria’s potential for offshore production. For Algeria and Libya, the reference
case projects an increase of 1.2 million barrels per day in
their combined liquids production from 2004 to 2015,
but after 2015 it is projected to remain fairly flat. Indonesia’s production is expected to decline over the projection period, and Venezuela is expected to see some
increase in production after 2015.Tables G1-G9 in
Appendix G show the ranges of production potential for
both OPEC and non-OPEC producers.
Geopolitical issues in a number of the OPEC countries,
including Iraq, Iran, Venezuela, and Nigeria, make it difficult to estimate future production levels. As a result,
there is a high level of uncertainty associated with the
reference case assumptions and projections for OPEC
production through 2030.
The IEO2007 high price case provides one scenario in
which OPEC limits production. Assuming lower availability of non-OPEC conventional resources, OPEC
would be able to exercise greater influence on oil prices.
Production of both OPEC and non-OPEC conventional
liquids is projected to increase in the high price case, but
at a slower rate than projected in the reference case.
Because higher prices would make more unconventional liquids production economically competitive,
non-OPEC liquids production is projected to be nearly
the same in the reference and high price cases, with
unconventional liquids replacing most of the reduction
in conventional production that is projected in the high
world oil price case.
The IEO2007 low price case assumes greater availability
of non-OPEC conventional resources than in the reference case. Oil prices fall as non-OPEC production
expands, and OPEC producers must increase production to meet their revenue requirements. As a result,
OPEC’s options for influencing the market are limited.
In the low price case, OPEC production is projected to be
about the same as in the reference case, but with lower
total revenues.
Oil Reserves and Resources
Historically, estimates of world oil reserves have generally trended upward (Figure 38) [3]. As of January 1,
2007,proved world oil reserves, as reported by Oil & Gas Journal,7 were estimated at 1,317 billion barrels—24 billion barrels (about 2 percent) higher than the estimate for 2006 [4] (Table 3). In addition to growth in remaining
oil reserves, production from conventional crude oil and
condensate reserves, natural gas plant liquids, Canadian
oil sands, and Venezuelan ultra-heavy oil during 2006
were estimated to be 30 billion barrels. Taken together,
the reserve increases and production imply that 54 billion barrels of reserve discoveries and growth occurred
during 2006, or an increase of about 4 percent.
Reserve estimates for oil, natural gas, and coal are difficult to develop. EIA develops estimates of reserves for
the United States but not for foreign countries. As a convenience to the public, EIA makes available global
reserve estimates from the Oil & Gas Journal, World Oil,
and BP’s Statistical Review of World Energy, and uses the
data in its analyses.
Proved reserves of crude oil are the estimated quantities
that geological and engineering data demonstrate with
reasonable certainty can be recovered in future years
from known reservoirs, assuming existing economic
and operating conditions. Companies whose stocks are
publicly traded on U.S. stock markets are required by the Securities and Exchange Commission (SEC) to report
their holdings of domestic and international proved
reserves, following specific guidelines. Country-level
estimates of proved reserves are developed from the
data reported to the SEC, from foreign government
reports, and from international geologic assessments.
Estimates are not always updated annually, and some
countries invest in exploration only to maintain a target
level of proved reserves. Thus, historical data series may
be relatively flat over some periods, with sudden jumps
in others.
Since 2000, the largest net increase in estimated proved
oil reserves has been made in Canada, with the addition
of 174 billion barrels of Canadian oil sands as a conventional reserve.8 Iranian oil reserves have increased by
46.6 billion barrels, or 52 percent, since 2000. Kazakhstan has had the third-largest increase, 24.6 billion barrels,
since 2000. The 10 countries with the largest net
increases in reserves between 2000 and 2007 are listed in Table 4. According to Oil & Gas Journal, 56 percent of the world’s total proved oil reserves are located in the Middle East (Figure 39). Among the top 20 reserve holders in 2007,11 are OPEC member countries that, together,
account for 65 percent of the world’s total reserves (Table 3). The largest declines in oil reserves between
2000 and 2007 were reported in Mexico (16.0 billion barrels), China (8.0 billion barrels), Norway (2.9 billion barrels), Australia (1.3 billion barrels), and the United
Kingdom (1.3 billion barrels).
The most common measure of the adequacy of proved
reserves relative to annual production is the reserve-to
production (r/p) ratio, which describes the number of
years of remaining production from current proved
reserves at current production rates. For the past 25
years, the U.S. r/p ratio has been between 9 and 12 years, and the top 40 countries in conventional crude oil production rarely have reported r/p ratios below 8 years.
The major oil-producing countries of OPEC have maintained r/p ratios of 20 to 100 years (Table 5).
Notes and Sources
References
Chapter 3 Tables 
|