Natural gas
Natural gas consumption
After a hot start to the summer, we expect close-to-normal temperatures will reduce U.S. natural gas consumption in August. We forecast natural gas consumption in the United States in August will fall slightly from July because of less natural gas consumption in the electric power sector. The electric power sector consumed 13% (5 Bcf/d) more natural gas in July than it did in June because of a heat wave and subsequent spike in natural gas-fired electricity generation.

Because electricity is used to meet demand for air conditioning during warm weather, natural gas consumption in the U.S. electric power sector is the primary driver of total natural gas consumption in the summer months. We forecast natural gas consumed to generate electricity in the United States to average 46 Bcf/d in August, down 2% from July.
U.S. natural gas consumption in the electric power sector in July approached the record level set a year earlier, despite Hurricane Beryl leaving millions of homes and businesses in Texas without electricity for several days in early July. More natural gas is consumed regularly to generate electricity in Texas than any other state, according to our Natural Gas Monthly. Heat wave conditions in other States in early July, particularly those in the West Coast and in the Northeast, and increased use of natural gas-fired electricity generation offset any declines in natural gas consumption for electric power because of the hurricane.
For 2024, we forecast about 1% more natural gas consumption in the United States than last year, averaging 90 Bcf/d. An increase in consumption in the residential and commercial sectors and the electric power sector offsets a decline in natural gas consumption in the industrial sector. Our forecast U.S. natural gas consumption declines by 1% in 2025 because of less consumption in the electric power sector. The forecast decline in U.S. natural gas-fired generation is the result of our assumption that next summer will be slightly cooler than this summer, reducing overall electricity generation, as well as the expansion of electricity generation for solar.

Natural gas production and prices
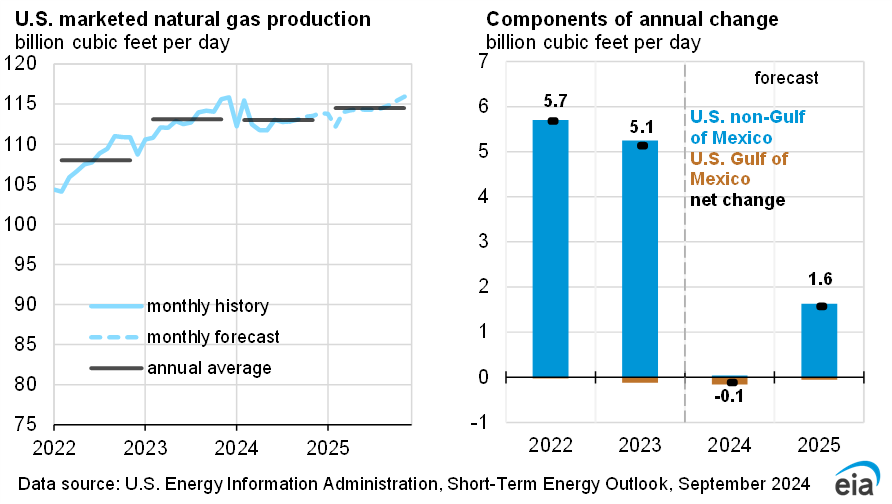
U.S. dry natural gas production averaged 103 Bcf/d in July, up about 1% (1 Bcf/d) from June. We forecast natural gas production in August to be about the same as it was in July, but 1% (1 Bcf/d) less than in August 2023. Record-low Henry Hub natural gas spot prices in 1H24 led producers to curtail natural gas production earlier this year. EQT, the largest natural gas producer in the United States, recently announced that it would continue to curtail production by about 0.5 Bcf/d through 2H24.
We forecast U.S. natural gas production to average 103 Bcf/d in 2024, down slightly from 2023, and then increase to average of 105 Bcf/d in 2025. The main drivers for our forecast of growth in U.S. production next year are an increasing Henry Hub price and growing natural gas demand as feedgas for liquefied natural gas (LNG) projects scheduled to come on line in 2H24 and 2025.

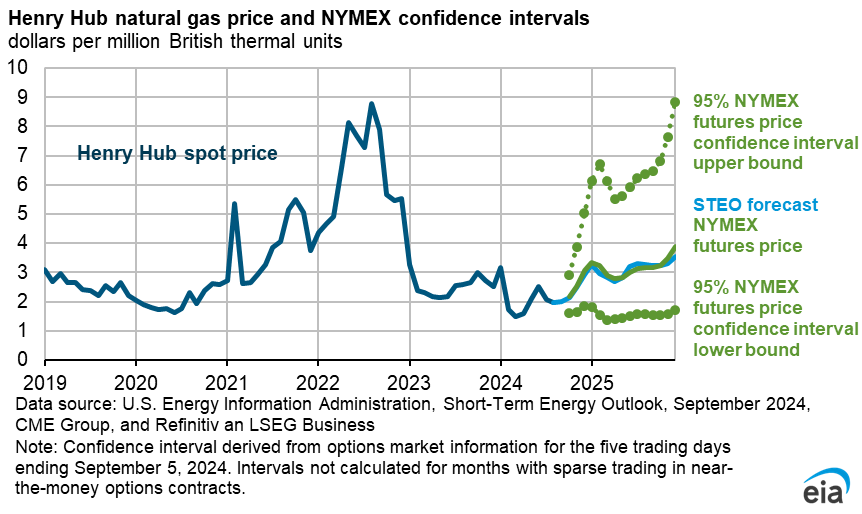
The U.S. benchmark Henry Hub spot price averaged $2.07 per million British thermal units (MMBtu) in July. We forecast the price will average about $2.60/MMBtu for the rest of 2024 (August–December), which is slightly less than the average of $2.69/MMBtu during the same period in 2023, and we expect the price to average $2.30/MMBtu for all of 2024. If natural gas production is greater and consumption in the electric power sector is less than we expect, prices could be lower than in our forecast.