2024 Midyear Investment Directions

KEY TAKEAWAYS

  • We upgrade our macroeconomic outlook based on continued strength in the U.S. economy, but remain cautious on still high inflation.
  • Our expectation for just two rate cuts leaves us committed to quality for the rest of the year, but pockets of opportunity suggest reasons for greater risk-taking.
  • A combination of high dispersion within asset classes, rising correlation between stocks and bonds, and election uncertainty means investors may want to consider relying on the experience and expertise of active managers to identify investible opportunities in the second half of 2024.

POSITIONING FOR FUNDAMENTAL TRANSFORMATION

We believe a seismic structural transformation is underway, with potential to reshape the investment landscape. It’s being driven by a potential surge in capital spending on artificial intelligence (AI), rewiring of global supply chains and the low-carbon transition. However, the speed, size and impact of that investment remains uncertain, and comes against an unusual economic backdrop. We lean into the transformation and look to adapt as the outlook changes, with a more nimble, granular approach to identifying investment opportunities. Investment Directions is our quarterly guide to meet this challenge, designed to help navigate opportunities in equities, fixed income, and international markets for H2 2024, with implementation ideas across index and active strategies. We remain bullish on AI, and see opportunity in the massive infrastructure investment — and energy — needed to fuel its expansion. On a tactical horizon, we see AI winners continuing to drive equities — despite recent tech-led volatility — yet turbulence in macro data is likely to keep dispersion and volatility high. We see scope for uncertainty to persist as markets digest election results around the globe and we approach the final straight to November’s U.S. vote. All this makes the case for quality and selectivity in equities, we think. Major developed market (DM) central banks have begun to ease back from decade highs, but we expect rates to stay higher for longer — putting carry in focus. At the same time, investors may want to look behind traditional allocations to build diversified portfolios that have the potential to outperform as the transformation unfolds.

Video 03:04

Our outlook has become modestly more positive since the end of Q1, thanks to the strength of the U.S. labor market, robust capital expenditures, and the resilience of the U.S. consumer, The macro backdrop supports a potential pivot toward riskier, high yielding assets but inflation remains sticky and geopolitical risks have been higher than normal.


Against this backdrop, we believe investors are best served by staying nimble across fixed income, equities, and international markets.


Hi, I’m Kristy Akullian, Head of iShares Investment Strategy for the Americas at BlackRock. Here are some of the key takeaways from our 2024 Midyear Investment Directions.


The overall trend towards lower inflation seems clear, but the Federal Reserve has said it needs more data before it would be confident enough to begin cutting rates. We believe continued improvements in inflation and gently slowing growth will allow the Fed to cut rates twice this year, with the first cut potentially arriving as soon as September.


Our expected path of monetary policy and U.S. growth could have important implications for asset allocation.


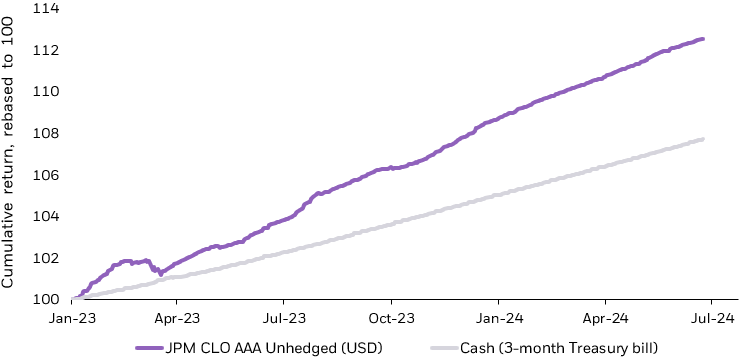
In fixed income, our outlook for normalizing interest rates implies a potentially favorable environment to extend duration out of cash ...and into the 3-to-7 year portion of the yield curve. We also see opportunities in potentially higher-yielding, short duration assets such as collateralized loan obligations or CLOs. Finally, we see a more important role for active management to be more selective within the high yield and corporate bond spaces.


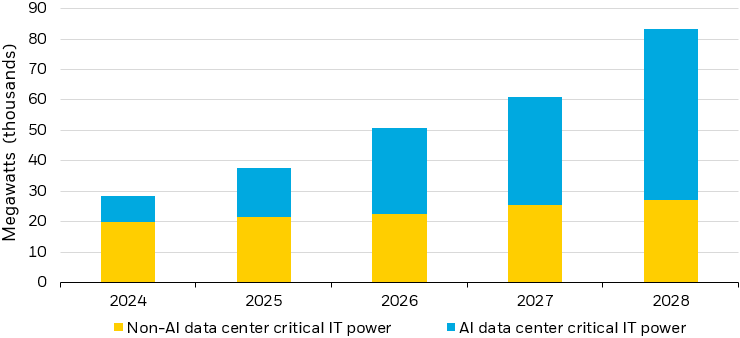
In U.S. equities, we lean into high quality exposures to seek to avoid companies that might come under stress in the Fed’s “higher-for-longer” rate environment. AI has also rapidly altered the investment landscape, leading to, in some instances, triple digit returns in associated companies. We see more potential AI-driven opportunities outside of technology, like the utilities sector. But identifying the most promising opportunities requires vigilance, also underscoring the potential significance of actively managed strategies in portfolios.


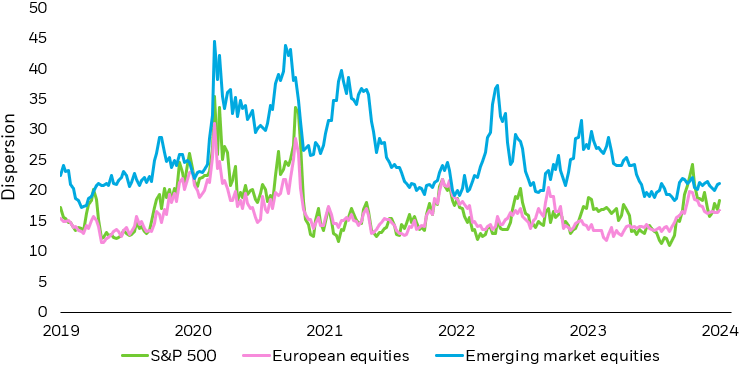
Looking overseas, dispersion between international markets remains higher than pre-covid levels. This shift underscores the need to be selective in international allocations, both on a short-term and long-term basis. It’s a big year of elections around the world, potentially introducing more volatility. We think Investors should look beyond short-term volatility and focus on longer-term strategic trends such as demographic transformations and supply chain rewiring.


These are just a few of the ways we are approaching the rest of the year. Check our full Midyear 2024 Investment Directions and stay tuned for a deep dive into each asset class coming soon.


Until then, I’m Kristy Akullian, thanks for watching!


Disclosures:

Past performance does not guarantee future results.


This material is not intended to be relied upon as a forecast, research or investment advice, and is not a recommendation, offer or solicitation to buy or sell any securities or to adopt any investment strategy. The opinions expressed are as of the date indicated and may change as subsequent conditions vary. The information and opinions contained in this material are derived from proprietary and nonproprietary sources deemed by BlackRock to be reliable, are not necessarily all-inclusive and are not guaranteed as to accuracy. As such, no warranty of accuracy or reliability is given and no responsibility arising in any other way for errors and omissions (including responsibility to any person by reason of negligence) is accepted by BlackRock. its officers. employees or agents. This material may contain "forward-looking” information that is not purely historical in nature. Such information may include, among other things, projections and forecasts. There is no guarantee that any of these views will come to pass. Reliance upon information in this material is at the sole discretion of the viewer.


This material contains general information only and does not take into account an individual's financial circumstances. This information should not be relied upon as a primary basis for an investment decision. Rather. an assessment should be made as to whether the information is appropriate in individual circumstances and consideration should be given to talking to a financial professional before making an investment decision. This material does not constitute any specific legal, tax or accounting advice. Please consult with qualified professionals for this type of advice.


Prepared by BlackRock Investments, LLC, member FINRA


©2024 BlackRock, Inc or its affiliates. All rights reserved. iSHARES and BLACKROCK are trademarks of BlackRock, Inc. or its affiliates. All other marks are the property of their respective owners.


iCRMH0724U/S-368498

MACRO

Since our last outlook in March, a broad sampling of data — such as nonfarm payrolls, ISM services, retail sales, and durable goods — reflects a U.S. economy with substantial growth momentum. Downside risks to growth have diminished as consumption and corporate earnings continue to come in strong and corporate defaults remain low despite higher interest rates. While we still expect the overall pace of growth to decelerate, our view is that the probability of a severe downturn in growth is now substantially lower than it was at the start of the year.

While better-than-expected growth has been positive news for financial markets, faster growth has also meant that inflation has remained sticky. The monthly run rate of Consumer Price Index (CPI) inflation accelerated at the start of the year, averaging 0.37% month-over-month over the first quarter, but has shown some deceleration in recent months, particularly in energy and core goods.1

We believe the Fed will still need a few months of softer inflation data before they are confident enough to cut rates. Though the overall pace of inflation has decelerated in recent months, there is enough in the details of the inflation data to give the Fed pause.

  • First, a significant portion of the decline in headline and core PCE has been led by volatile components, suggesting that some of the disinflation could be temporary or an artifact of sampling.
  • Second, housing inflation has remained sticky, with the long-expected decline in rental inflation remaining elusive. The housing index has increased 5.5% over the last year, accounting for over two-thirds of year-over-year core inflation.2 Unless we see a slowdown in housing, we believe it will be hard to sustainably cool inflation.
  • Last, services inflation ex housing, which historically has a strong correlation with wages, has also remained at 3.4%, well above the Fed’s level of comfort.3 

We believe gently decelerating growth will allow the Fed to cut rates twice this year, first in September and then again in December. Two cuts would still leave policy rates in restrictive territory and allow gradual disinflation to proceed. We would caution against overinterpreting the median dot of the Fed’s ‘dot plot’, which now shows a median expectation of just one rate cut through the end of 2024.4 The median dot is a shorthand created by market observers rather than by the FOMC and may underestimate the impact of the most influential views that often carry the day in policy decisions.

Finally, we anticipate the pace of Fed rate cuts will lag the pace of other global central banks, supporting the strength of the U.S. dollar.

Figure 1: What are the potential paths for inflation?

Line chart showing the path of core PCE inflation and the potential outcomes assuming 0.1%, 0.2%, and 0.3% month-over-month inflation.

Source: BlackRock. Personal Consumption Expenditures (PCE) from the Bureau of Economic Analysis. As of June 24, 2024.

Chart description: Line chart showing the path of core PCE inflation and the potential outcomes assuming 0.1%, 0.2%, and 0.3% month-over-month inflation.


FIXED INCOME

Our macroeconomic outlook for slowly normalizing interest rates and gently decelerating growth implies a favorable environment for carry and modest duration extension. While we don’t believe that policy rates are likely to return to pre-pandemic levels given structurally higher inflation and the AI-fueled investment boom, we anticipate that stable growth and slowing inflation can provide an opportunity for clipping coupons in fixed income markets. However, the uncertainty around inflation — and therefore Fed policy — creates volatility that calls for careful and precise navigation.

We believe the ‘belly’ of the curve presents the best trade-off between current yield and the potential for returns from falling rates and duration. In our view, the ICE US Treasury 3-7 Year Bond Index is ideally placed to take advantage of potential outperformance in the belly of the curve.

We expect the yield curve to steepen, led by declines in rates on the short end of the curve. We remain cautious about taking exposure at the very long end of the yield curve, as we expect additional issuance and the normalization of term premium will keep longer rates elevated.

In contrast to the front end of the yield curve, the long end of the yield curve has been positively correlated with the S&P 500 for all of 2024, making it a poor diversifier.5 For the past year, upside and downside misses on monthly CPI inflation prints have generated a positively correlated price reaction in stocks and long-dated bonds.

Figure 2: The last 11 months of CPI surprises have seen positive stock-bond correlations

Bar chart showing the one-day change of stocks and bonds on days when CPI reports have come out stronger or weaker than expected.

Source: BlackRock, Bloomberg. Stock performance represented by the S&P 500 (SPX Index). Bond performance represented by U.S. Long Treasury Total Return Index (LUTLTRUU Index). As of June 20, 2024. Indexes are unmanaged and one cannot invest directly in an index. Past performance does not guarantee future results.

Chart description: Bar chart showing the one-day change of stocks and bonds on days when CPI reports have come out stronger or weaker than expected.


Even on the short end of the yield curve, there are opportunities beyond cash for spread income. Given the persistent inversion of the yield curve and our expectations for only a gradual reduction in policy rates, it could make sense to have some allocation to short-term rates. High quality CLOs currently offer a yield of above 6.5% with a duration of only 0.11 years.6 Due to their credit enhancement via overcollateralization and subordination, super senior CLO tranches achieve a credit rating of AAA. Despite their top credit rating, CLO AAA new issue spreads are still around 140 basis points above Treasuries with similar maturities, representing a potentially attractive yield pickup relative to their credit risk.7

Figure 3: High quality CLOs have offered yields above Treasuries with similar maturities

Line chart showing the cumulative returns of 3-month Treasury bills and the JP Morgan CLO AAA Unhedged Index since January 2023.

Source: BlackRock, Bloomberg. Treasury Bill as represented by Ice BofA 0-3 Month US Treasury Bill Index, high quality CLO as represented by JP Morgan CLO AAA Unhedged Index. Total returns rebased to 100 on January 1, 2023. As of June 18, 2024.

Chart description: Line chart showing the cumulative returns of 3-month Treasury bills and the JP Morgan CLO AAA Unhedged Index since January 2023.


Corporate credit fundamentals look satisfactory, and we believe that above-potential growth could support corporate earnings and keep default rates low. While all-in yields in corporate credit look attractive, spreads have tightened meaningfully in the past 12 months. The tug of war between attractive yields and rich spreads could argue for more selectivity in allocations to corporate credit. High dispersion among credit index constituents and industries has created several relative value opportunities. Investors looking beyond broad index credit exposure may want to consider strategies that screen out the riskiest borrowers and invest in issues with the highest risk-adjusted yields. Such strategies may find pockets of value within an otherwise fully valued asset class.

We also see opportunities in EM debt, with continued deceleration in inflation and potential improvements in the global rate environment in the second half of 2024. Currently, we favor hard currency debt over local currency debt given our view that the USD will likely remain rangebound from here.

FEATURED iSHARES FUNDS

U.S. EQUITIES

Despite posting double digit returns on the year, the U.S. equity market’s 12-month forward P/E remains unchanged from its starting level, indicating that returns have been fueled by earnings durability, not multiple expansion.8  Narrow leadership has begun to broaden out, with 10 of the 11 S&P sectors in positive territory. At this time last year, only three sectors contributed to the market’s gains, each tech or tech adjacent. But the back half of the year holds much uncertainty, specifically around the timing of Fed cuts and the results of the U.S. election. This is an environment expected to reward selectivity and nimbleness against a backdrop of shifting narratives.

Figure 4: Market gains while valuations stay in line with historic averages

Lne chart showing the price of the S&P 500 along with 12-month forward P/E, since January 2024.

Source: BlackRock, Bloomberg. As of June 24, 2024. Index performance is for illustrative purposes only. Index performance does not reflect any management fees, transaction costs or expenses. Indexes are unmanaged and one cannot invest directly in an index. Past performance does not guarantee future results.

Chart description: Line chart showing the price of the S&P 500 along with 12-month forward P/E, since January 2024.


The quality factor is our preferred way to help avoid the riskiest pockets of the equity market, combining profitability and balance sheet strength with the aim of delivering positive returns even in a higher rate regime. That contrasts sharply with small and unprofitable names where restrictive monetary policy carries more bite: nearly half of the Russell 2000 constituents hold floating-rate debt, triple the total held by their large-cap counterparts.9

Amid big, structural changes in the economy, we see opportunity in a range of active strategies to complement quality at the core of a portfolio.

  • Unconstrained strategies that are not bound by industry, sector, or geographic restrictions may be best suited to capitalize on such changes. Managers with the discretion to hold high-performing stocks over extended periods may benefit from compounding to enhance portfolio returns.
  • Alternatively, systematic active management provides the tactical agility to rotate quickly amid changing themes and equity leadership, with the potential to capture near term trends and dislocations. For example, when it comes time to lean into unloved portions of the market, a quantitative, tactical framework leveraging traditional and alternative data sources may be better suited to identify inflection points than standard asset allocation strategies.

Active management also allows investor portfolio composition to shift without the need to rebalance, and in a potentially tax efficient ETF wrapper. This may be especially important in a year we expect to be shaped by a variety of cross currents.

With election uncertainty ahead, the intersection of economics and geopolitics is more in focus than ever. Domestic and foreign policy is being reshaped with lasting impacts on supply chains, with technology and manufacturing at the center of the 21st century economic arms race. We see opportunity in the companies that are reshoring jobs and bolstering U.S. technological independence. With the space evolving rapidly, we turn to active management to identify the firms poised to benefit from geopolitical headwinds and capitalize on the rewiring of global supply chains.

FEATURED iSHARES FUNDS

ARTIFICIAL INTELLIGENCE

The arrival of artificial intelligence rapidly altered the investment landscape — triple-digit returns, and record earnings growth of AI-associated companies were largely undeterred by rates, growth, or inflation expectations. The breakthrough technology has already translated to substantial revenues and demand for clear beneficiaries — semiconductors are at the core of this transformation, and the industry has returned 85% so far this year, on the heels of triple digit 2023 gains.10

Rapid AI growth also necessitates significant energy demand. The electricity required to train AI software ChatGPT-3 could power 90,000 U.S. homes for a year; training its successor, GPT-4, needed the electricity to power 2.5 million homes.11 Models are only getting larger, and while this expansion poses challenges (AI data centers are moving to cooler regions to manage energy consumption), it also highlights an opportunity for electricity providers. Utilities are dialing up demand forecasts and, despite the sector’s recent 10.3% year-to-date rally, remain largely under-owned as the sector shed $1.1bn in outflows on the year.12 We turn constructive on this underappreciated AI-beneficiary, with strong fundamentals also supporting our optimism: the semiconductor industry’s 12-month forward P/E has swelled to double its long-term average while utilities trade at a discount to their long-term average, making the sector a more compelling entry point for the next phase of this trade.13

Figure 5: AI data centers are expected to consume more and more power

Bar chart showing expected critical IT power consume for global non-AI and AI data centers from 2024 to 2028.

Source: BlackRock Fundamental Equity Team and Semianalysis.com, “AI Datacenter Energy Dilemma — Race for AI Datacenter Space”, as of March 13, 2024. Critical IT power is defined as the usable electrical capacity at the data center floor available to compute for servers and networking equipment housed within the server racks. Megawatts measure the power capacity available to data center. For illustrative purposes only. Forward-looking estimates may not come to pass.

Chart description: Bar chart showing expected critical IT power consume for global non-AI and AI data centers from 2024 to 2028.


While AI will streamline operations, improve customer experiences, and drive human innovation, identifying the most promising AI-driven opportunities requires expertise and vigilance. We believe investors could turn to active managers with a proven track record to navigate the rapidly evolving AI landscape and capitalize on the technological opportunities that come from the transformative power of AI.

FEATURED iSHARES FUNDS

INTERNATIONAL EQUITIES

Selectivity and dispersion

Country dispersion has picked up meaningfully compared to the average of the 2010s, although down from the peak, accelerated by a trend of broader de-globalization. This shift underscores the importance of selectivity in the international market, both on a tactical and strategic basis. Investors have increasingly used granular geographic exposures such as EM ex-China for regional allocations, single country ETFs to get dedicated exposures in countries like Mexico and India, or active manager strategies that allow flexible adjustment of country weights based on high conviction investment ideas.

Figure 6: Emerging market dispersion is higher than developed markets

Line chart depicting the 26-week rolling return dispersion in the S&P 500, European equities, and emerging market equities.

Source: GPS Investment Strategy, Reuters Refinitiv Datastream. As of June 25, 2024. Average return dispersion calculated using weekly USD returns on a rolling 26-week window across countries in the MSCI All Country World Index (ACWI) using the respective MSCI country indexes. S&P 500 represented by SPX Index. Index performance is for illustrative purposes only. Index performance does not reflect any management fees, transaction costs or expenses. Indexes are unmanaged and one cannot invest directly in an index. Past performance does not guarantee future results.

Chart description: Line chart depicting the 26-week rolling return dispersion in the S&P 500, European equities, and emerging market equities.


Recent elections in Mexico and India demonstrate how market reactions to election outcomes can lead to rapid spikes in near-term market volatility. Both India and Mexico experienced meaningful selloffs immediately following their unexpected election results — a sweep in the Mexican presidential and legislative elections by the incumbent party, and a lack of a similar sweep in India. Meanwhile, a shifting European political landscape could also translate to heightened uncertainty and potential downside risks to equity markets.

Investors could look beyond short-term volatility to focus on longer-term strategic trends. We see investable opportunities in demographic transformations and supply chain reshoring (see the Thematic Mid-Year Update). Despite investor caution in Mexico and India due to post-election policy uncertainty, we see long-term investment opportunities in those countries due to the benefits from higher working age population and reshoring-related infrastructure and business investments.

The U.S. election poses risks for Latin America, with potential implications on immigration and tariffs that may challenge the Mexican equity market. On a tactical basis, we favor Chile as a country trading on justified valuations that could tactically benefit from its exposure to the copper mining industry, accelerated by stronger energy demand from rapid AI developments.

U.S. investors continue to separate China from broader EM allocations. While Chinese equities experienced a recent rebound on the back of discounted valuations and better-than-expected policy support and macro data, a bevy of structural worries such as declining demand in the property sectors and slowing demographic growth continue to weigh on risk sentiment. U.S.-listed ETFs with a geographic focus on EM ex-China regions attracted nearly $4.4bn from the investor community YTD.14 Reallocation in Asia also spotlights Japanese equities. Corporate reforms, monetary policy pivots, and return of real growth in the country could lead to more equity flows back to the market.

FEATURED iSHARES FUNDS

Photo: Gargi Pal Chaudhuri

Gargi Pal Chaudhuri

Head of iShares Investment Strategy Americas at BlackRock

Kristy Akullian, CFA

Investment Strategist

Contributor

Nick Morales

Investment Strategist

Contributor

David Jones

Investment Strategist

Contributor

Jasmine Fan, CFA

Investment Strategist

Contributor

Faye Witherall

Investment Strategist

Contributor

Jon Angel

Investment Strategist

Contributor

David Hernandez

Investment Strategist

Contributor