
Why Front-Page News Can Mislead Investors
Extreme pessimism—the kind that often leads the news—can potentially be fertile ground for investment opportunities.

Charlie Munger died late last year, but he left behind a wealth of wisdom.
A famous quote of his was “invert, always invert.” By which he meant it’s often beneficial to think about things backward. When it appears that conventional wisdom is well established, attempt to think differently.
This is a useful mental framework to utilize as the stock market swings between optimism and pessimism.
At periods of extreme optimism, stocks are often expensive. If investors hope to profit from expensive stocks, the most effective strategy is to go short, or bet against them.
But that’s easier said than done.
Enron went bankrupt in December 2001, but prior to its Chapter 11, it was named by Fortune magazine as “America’s Most Innovative Company” for six consecutive years. Enron was among the top-performing stocks in the market during that time.
Put simply, shorting stocks is hard. Even if you’re right, there’s potential to lose significant money along the way.
The other side of the coin is extreme pessimism. This often presents a backdrop where stocks can become cheap, a scenario that is often more compelling.
Pessimism can potentially lay a foundation for future success. Why? The world gets better over time. And when market prices begin to reflect too much negativity, that’s fertile ground for investors.
But the caveat is: You must be willing to think differently. Stocks don’t go on sale without a reason; it typically occurs because of a company-specific event, an asset class falling out of favor, or a crisis of some variety.
Here are a few examples across companies and industries that we’ll use to illustrate this concept.
Example 1: Facebook
Facebook (now Meta Platforms META) went public in 2012 and ascended to become one of the world’s largest companies.
But it hasn’t all been smooth sailing. Since going public, Facebook’s stock has had:
- Seven separate drawdowns of more than 20%
- Four of those drawdowns turned into 30% declines
- Three of those drawdowns turned into 40% declines
- The peak-to-trough maximum drawdown has been 76%
Each drawdown included a story suggesting that the company’s best days were behind it, often pointing to competition or regulation as the culprit.
Facebook’s best days will eventually be in the rearview mirror—like every company’s, inevitably—but that’s not what these past drawdowns reflected.
The most recent drawdown came in 2022. In September 2021, the stock was at all-time highs. By November 2022, the stock had fallen 76%. This period represented a massive shift in its business and a time when the company renamed itself to Meta.
Many headlines made it appear obvious that the company had peaked, such as:
CNBC Sept. 30, 2022 - Facebook scrambles to escape stock’s death spiral as users flee, sales drop
One analyst quoted in the article stated, “I’m not sure there’s a core business that works anymore at Facebook.”
The company was falling out of favor with investors as they poured billions into its metaverse strategy. Capital expenditures—purchases of property and equipment—jumped nearly 70% to $32 billion in 2022.
Facebook Capital Expenditures (millions)

The running joke was, “What are they building, the Death Star?” In short, spending was out of control.
What happened next? While oversimplified, management improved the company’s financial discipline, labeling 2023 as its “Year of Efficiency.” As spending rationalized, the stock began to climb. Meta’s shares have increased by more than 400% since that time, outpacing an index of large-cap stocks nearly tenfold.
Total Returns, Meta vs. Large Cap Index (November 2022 - May 2024)

Example 2: Energy Stocks
The 2010s were one of the greatest bull markets ever for US stocks. For energy stocks, it was a lost decade.
Energy stocks returned negative 7% from 2010 through 2020, while large-cap stocks compounded at 13.7% annually for a total return of more than 300%.
Market-Cap Comparison
At the end of 2020, energy stocks made up around 2% of the S&P 500′s market cap, down from nearly 30% in 1980. Investors had essentially left energy stocks for dead. Returns had been terrible, bankruptcies were common, and oil was a commodity in secular decline.
Things looked bad, and then they got worse. In a historic move, oil prices briefly went negative in 2020, and as The New York Times pointed out, a barrel of oil was worth less than nothing:
The New York Times Sept. 28, 2021 - Too Much Oil: How a Barrel Came to Be Worth Less Than Nothing
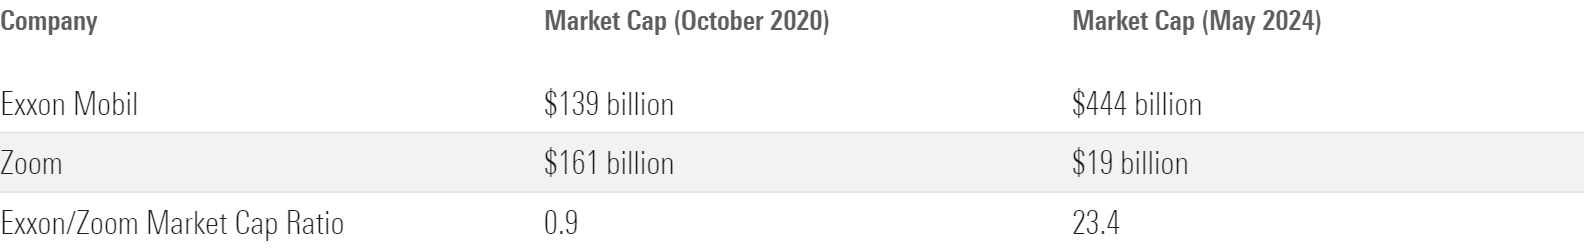
The market cap of Zoom Video Communications ZM—a company founded in 2011—surpassed that of Exxon Mobil XOM, the largest US oil company, with a history that dates to 1866:
Business Insider October 2020 - Zoom overtakes Exxon Mobil in market value amid COVID-19 pandemic
And CNBC’s Jim Cramer went as far as to say he was done with the stocks of fossil fuel companies.
But none of this served as a final verdict on oil’s future. Rather, it planted the seeds for improvement.
Companies build muscle during hard times. The energy industry is very different today from what it was a decade ago. There is less debt, capital is being returned to shareholders (buybacks and dividends) instead of being used to pursue more oil production, and valuations are undemanding, given that many investors gave up on the asset class.
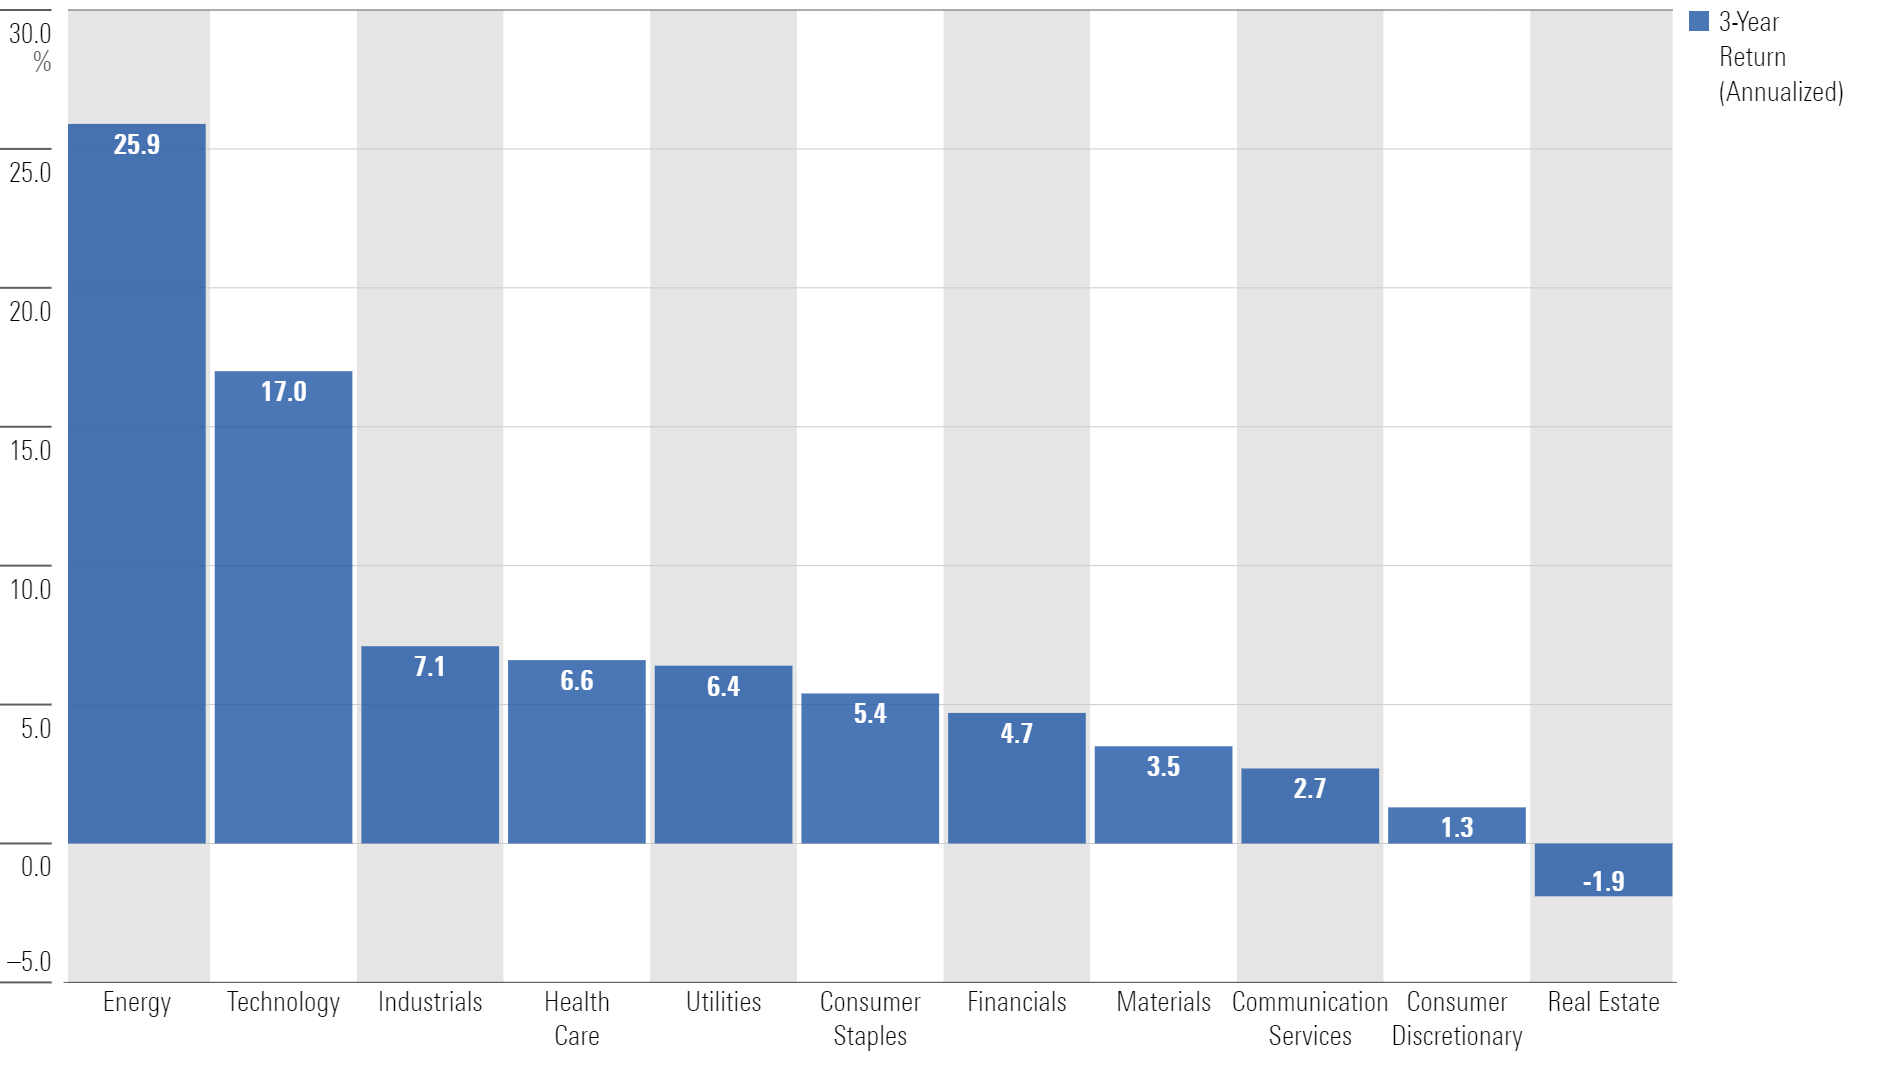
And now returns are catching up. Energy is the best performing sector over the past three years.
Sector Returns (May 2021 - May 2024)
And Exxon Mobil’s market cap is now 23 times larger than Zoom’s.
Market-Cap Comparison

Another interesting anecdote, though not a factor in recent returns, is that the largest energy companies are also some of the biggest investors in energy projects of the future. Burgeoning industries like carbon capture, hydrogen production, and sustainable aviation fuel are being pushed forward through capital commitments made by traditional oil companies.
Whatever your prediction for when the last drop of oil is used—and opinions on that subject span from years to millennia—these companies are investing to ensure their long-term viability.
Which is something the market may not fully appreciate, leading to a potential opportunity for investors.
Example 3: Banks
Obituaries were being written for the banking sector last March.
From the initial rumors through its total demise, Silicon Valley Bank only lasted a couple of days. It was a stark reminder that risk happens fast, and you don’t realize how precious confidence is until it evaporates.
An index of regional bank stocks fell more than 40% from March 1 through mid-May.
Total Returns, Regional Banks (March 2023 - May 2023)

The headlines were ugly:
CNBC March 2023 - May 2023 -
Silicon Valley Bank shut down by regulators in biggest bank failure since global financial crisis
Financial shares fall as Credit Suisse becomes latest crisis for the sector
JPMorgan Chase takes over First Republic after biggest U.S. bank failure since 2008
Regional bank stocks continue to slide with PacWest leading the way down 50%
The market is looking for the next ‘domino’ to fall, keeping banks under pressure
Conventional wisdom indicated that the entire banking sector was in trouble. However, the reality was quite different.
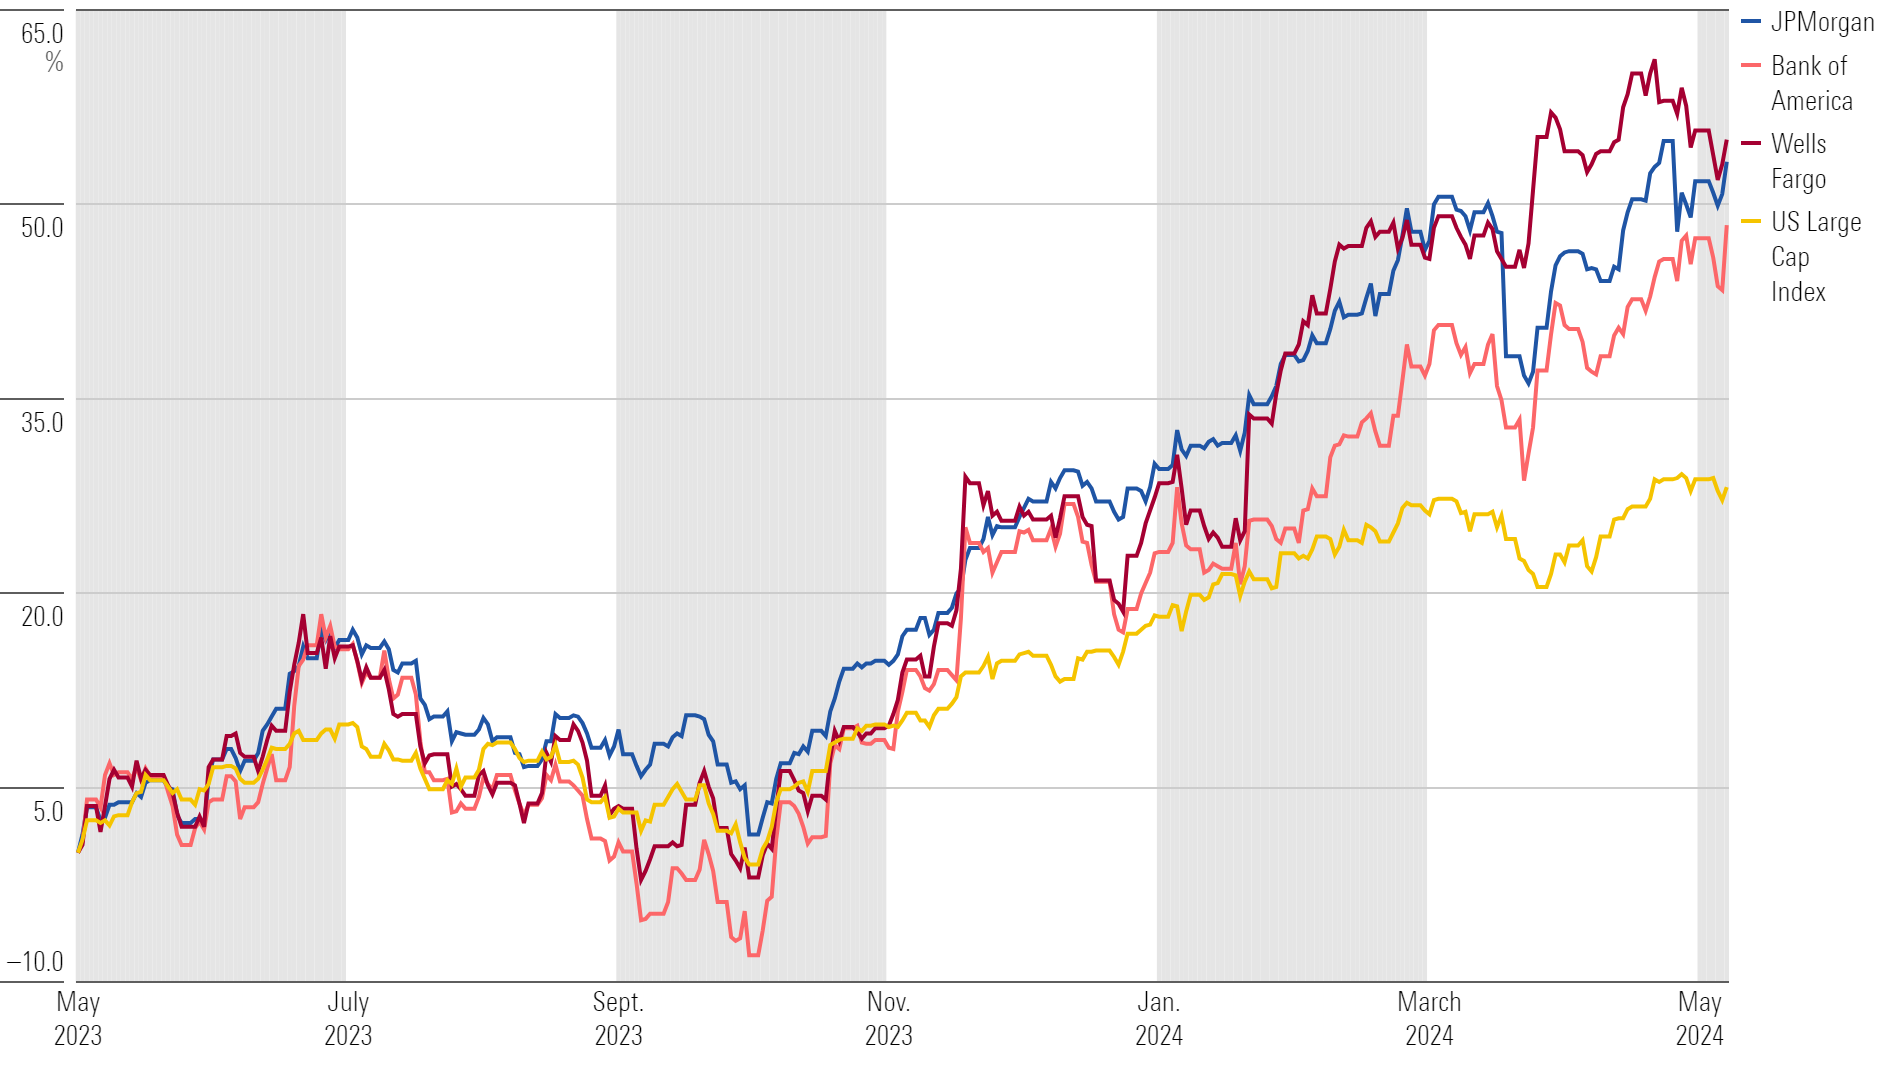
As regional banks tried to contain the fire, depositors sought safer havens for their money, leading many to turn to the largest, most durable franchises in banking like JPMorgan Chase JPM, Wells Fargo WFC, and Bank of America BAC. JPMorgan even acquired First Republic Bank at a bargain price, effectively capitalizing on the crisis.
And a year later, it’s clear that too much negativity might have seeped in. All the banks mentioned outperformed an index of large-cap stocks over the past year.
Total Returns Among Large Banks (May 2023 - May 2024)
For investors willing to think differently, the banking crisis presented an opportunity rather than a major risk event.
Going Beyond the Headlines
The common theme in each example is that headlines can easily mislead. Former Fidelity fund manager Peter Lynch was fond of saying the front page of the newspaper carried the negative stories intended to capture the widest readership.
Facebook’s demise, the fall of oil stocks, and a banking crisis all fit the bill.
But Lynch went on to add that while the front page carries the salacious stories, the back pages have all the facts, and that’s where you need to be focusing your attention.
Lynch’s point is that the stories others are ignoring—or afraid to touch because of overwhelming negativity—are often a great place for investors to focus attention.
If you look at the past 50 years in the stock market, the average intrayear decline for stocks—on average—is about 14%. But if you look at individual stocks, the average fluctuation between the 52-week high and 52-week low is closer to 50%.
Point being, every year there will be opportunities that investors can potentially use to their advantage.
As Charlie Munger said, opportunity comes to the prepared mind.
The author or authors do not own shares in any securities mentioned in this article. Find out about Morningstar’s editorial policies.
Morningstar Investment Management LLC is a Registered Investment Advisor and subsidiary of Morningstar, Inc. The Morningstar name and logo are registered marks of Morningstar, Inc. Opinions expressed are as of the date indicated; such opinions are subject to change without notice. Morningstar Investment Management and its affiliates shall not be responsible for any trading decisions, damages, or other losses resulting from, or related to, the information, data, analyses or opinions or their use. This commentary is for informational purposes only. The information data, analyses, and opinions presented herein do not constitute investment advice, are provided solely for informational purposes and therefore are not an offer to buy or sell a security. Before making any investment decision, please consider consulting a financial or tax professional regarding your unique situation.
/cloudfront-us-east-1.images.arcpublishing.com/morningstar/2TUAYYD4PVBTFEBHVOLROKDOY4.png)
/cloudfront-us-east-1.images.arcpublishing.com/morningstar/KWYKRGOPCBCE3PJQ5D4VRUVZNM.jpg)
/d10o6nnig0wrdw.cloudfront.net/06-27-2024/t_2194d771c3f04756b6635f949463d5c6_name_MIC_24_Kunal_Kapoor_Speaker_1920x1080.png)