Individual Card Usage Analytics
The use of on-Card analytics gives authors and Collection owners valuable insights into the performance of their Card content and identifies the individuals who are utilizing the Card. By knowing which users are accessing specific Cards, you can customize your approach to the team and develop new assets or edit existing assets while gaining an understanding of what is helping your colleagues work more efficiently.
Accessing Card usage and analytics
In the Card's Usage and analytics dashboard, all users can view reports relevant to the specific Card.
Note
All Analytics widgets will update every 1-2 hours with your team's information. Analytics data will go back to the date that the user started using Guru.
- Open the desired Card in Guru's web app or browser extension.
- Click the ellipses menu at the top of the Card, then click Usage and analytics.
- Click the text Back to Card text at the top of the Card to return to the previous view of the Card. Click the "X" icon to close the Card.

Understanding Card usage reports
The filters, located at the top of the page, can be used to modify the data displayed in all of the dashboard's reports.
- Event Date. View data from a specific timeframe (on, on or after, on or before, between).
- Group Name. All of the Groups in your Guru workspace. Use to filter by a specific Group's activity.
- User Display Name. All of the users in your Guru workspace. Use to filter by a specific user's activity.
Below is a summary of each widget and the insights provided:
Total Card views
- The number of Card views in the most recent week a view occurred.
- The percent change in views and the total number of views in the week prior.
- An area chart displaying weekly Card views in the specified timeframe.
Card views over time
- A combination chart displaying bars representing total Card views and a line representing the total number of Card copies in each month of the specified timeframe.
Card usage by user (Admin access required)
- A table listing all users who have accessed the Card in the specified timeframe.
- Table column headers include the user's Display Name, Email address, the user's total number of Views of the Card, whether or not the user Follows the Card, and whether or not the user has this Card saved as a Favorite.
Favorites and follows over time
- A bar chart displaying the total number of times a user clicked to favorite the Card or follow the Card in each month of the specified timeframe.
Card usage by surface
- A line chart displaying trends for where, or in what source application, the total number of user interactions with this Card occurred in each month of the specified timeframe.
- Use this chart to determine where users are accessing this Card the most (web app, extension, API, etc.)
Card favorites
- A table displaying who favorited the Card by name and the date they favorited the Card.
- The table shows the first 1,000 rows of data by default. To view all rows (i.e. all Cards), download the report as a CSV.
Card follows
- A table displaying all followers by name and the date each user followed the Card.
- The table shows the first 1,000 rows of data by default. To view all rows (i.e. all Cards), download the report as a CSV.
Downloading Card usage analytics
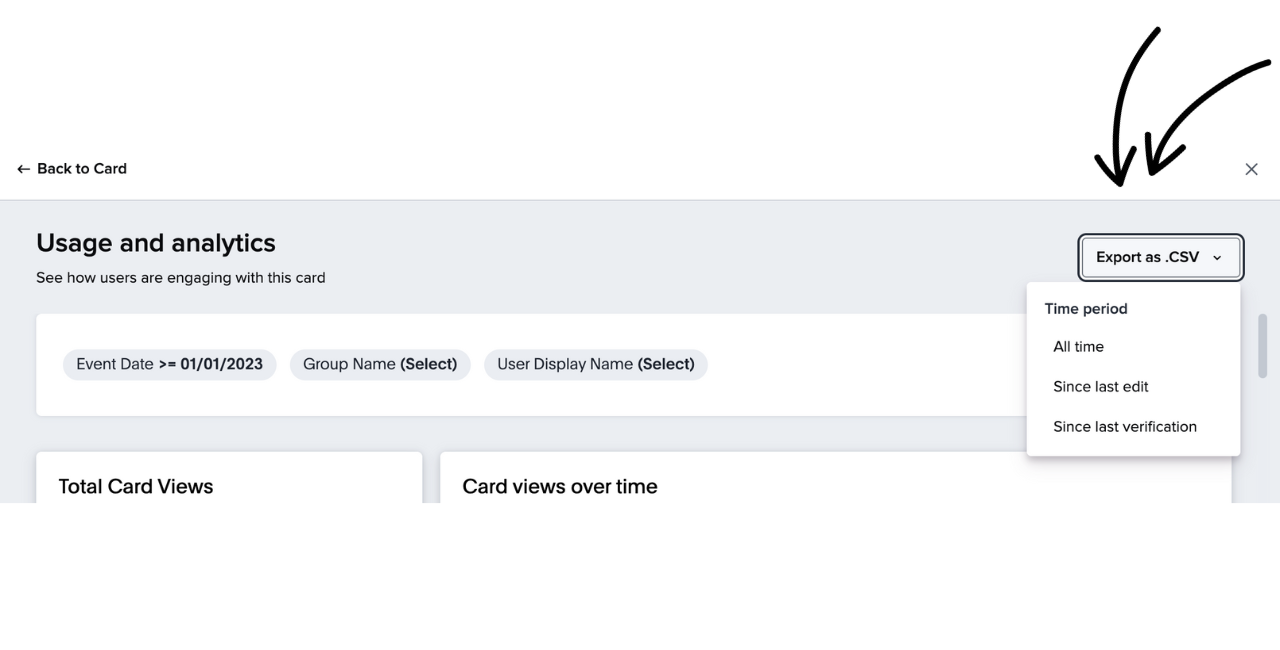
Download the Card's usage analytics to view activity across the Card's entire existence, since the Card's last edit, or since the Card's last verification. Click Export as .CSV to expand the drop-down menu of options for the Card export's Time period.
You can also download individual reports as CSV files or schedule the entire dashboard to be emailed to you on a recurring basis.
Evaluating Card usage
There is some overlap between the Card Usage and analytics dashboard and the workspace's Knowledge Usage analytics dashboard. With access to both sets of reports, you can compare an individual Card's performance against the performance of Cards in the same Collection (Most Viewed Cards, Most favorited Cards, Most followed Cards, or Card views over time filtered by Collection Name).
If the Card was ever used for an announcement, you can review the Announcement Insights from the Card alongside the receiving Group's average performance with all announcements in the web app's Announcements analytics dashboard.
Finally, both the Card Usage and analytics dashboard and the Group and User Drill-Down analytics dashboard can be used to explore a specific team member's activity with a specific Card. Ultimately, sending an announcement is the best way to confirm a user has opened a Card and has read it.
Best practice use cases
- In the context of sales or support reps who have hit or exceeded team KPIs, discuss with those reps how they used their most viewed content and share their learnings with the wider team. This way, everyone on their team can improve by utilizing winning assets.
- Themes emerging from Cards utilized by top-performing reps can also be gathered and shared at a regular cadence, creating a feedback loop between customer-facing teams and your Product or Marketing teams.
- In the individual user drill down, review their most popular Cards. In the context of Human Resources or People Ops and onboarding management, you can use these metrics to check to see that new hires are engaging with their onboarding information.
Updated about 2 months ago